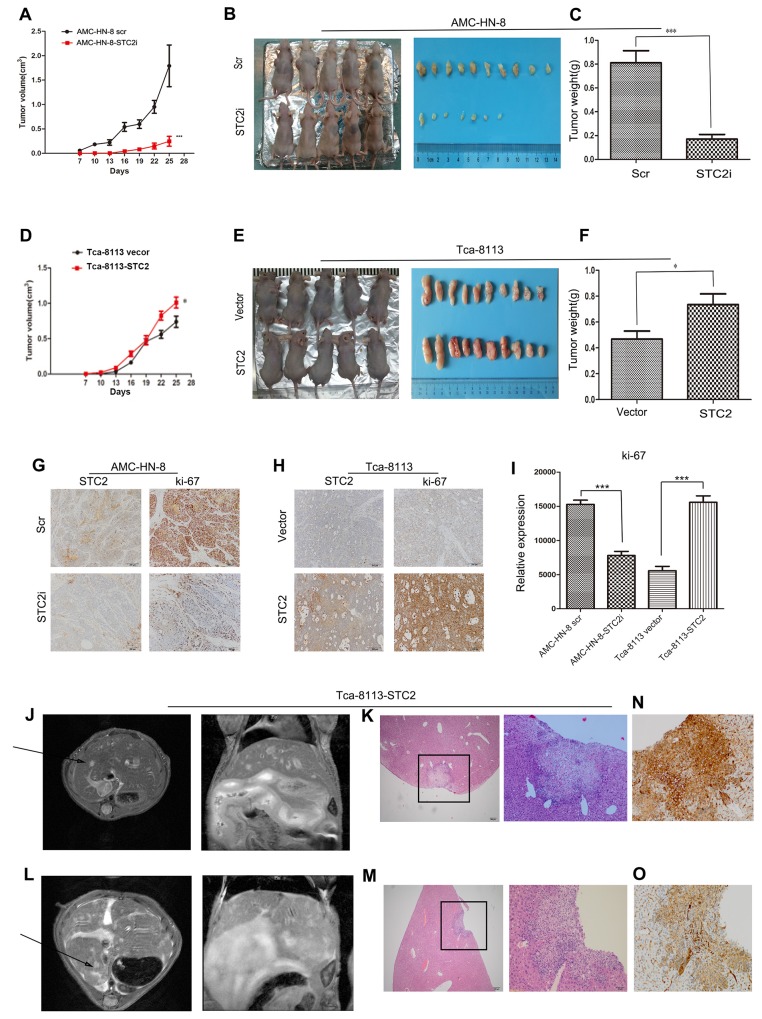
Figure 4. STC2 promotes the growth of HNSCC and tumor metastasis in vivo.
A. In vivo tumor growth examined by animal assay. Data are expressed as the mean +/− SD. ***P < 0.001. B. Dissection of xenograft tumors. C. Quantitative analyses of the weight of the tumor formed in STC2i-animals (***P < 0.001). Error bars = 95% CIs. D. In vivo tumor growth examined by overexpression of STC2 in animal assay. Data are expressed as the mean +/− SD. *P < 0.05. E. Dissection of xenograft tumors. F. Quantitative analyses of the weight of the tumor formed in STC2-animals (*P < 0.05). Error bars = 95% CIs. G, H. Immunohistochemical analyses of STC2 (G) and Ki67-positive cells (H) in tumor xenograft samples. Magnification, × 200. I. The number of Ki67-positive cells per field (five randomly selected visual fields) at 200× magnification. Data are expressed as the mean +/− SD of three samples per group. ***P < 0.001. J, L. Selected images from MRI dataset from Tca-8113-STC2 tumour model. Hyper intense lesion in T2-weighted acquisition for both axial plane scanning and coronal scanning are clearly visible (arrowheads). K, M, N, O. Metastatic sites were verified with HE staining and p40 staining by immunohistochemistry. Magnification, × 40 and × 200.

