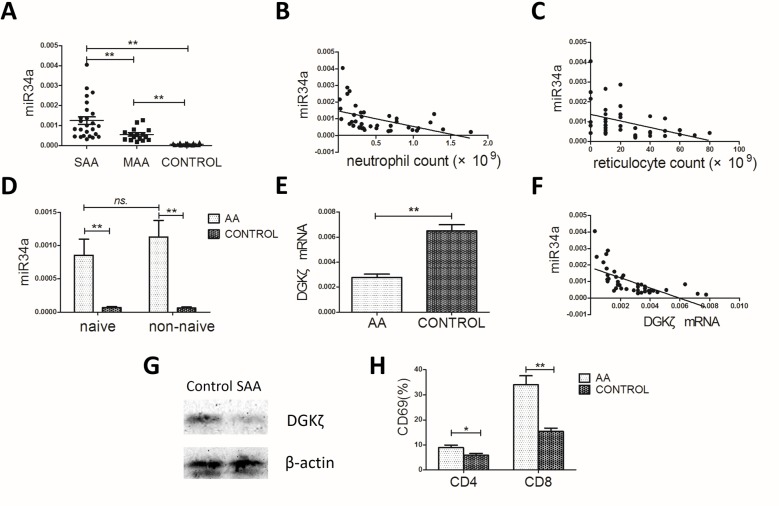
Figure 2. miR34a, DGKζ and CD69 expression in the AA patients and controls.
(A) miR34a expression in AA patients (n = 41) was much higher than in controls (n = 20), while in SAA group (n = 25) it's much higher than in MAA group (n = 16) (one-way ANOVA, with LSD post-test). (B, C) Correlations between miR34a level and peripheral blood neutrophil count or reticulocyte count in the 41 AA patients (Spearman's test). (D) miR34a expression in naïve T and non-naïve T cells from SAA patients (n = 8) and controls (n = 8). (E) DGKζ mRNA level in BMMCs (Student's t-tests). (F) Negative correlation between DGKζ mRNA level and miR34a level in AA patients (Spearman's test). (G) The representative data of DGKζ protein expression in BMMCs from SAA patients (n = 8) and controls (n = 8). (H) The proportion of surface CD69+ cells among CD4+ and CD8+ BMMC in AA patients and controls (Student's t-tests). Mean ± SEM. *P < 0.05; **P < 0.01.

