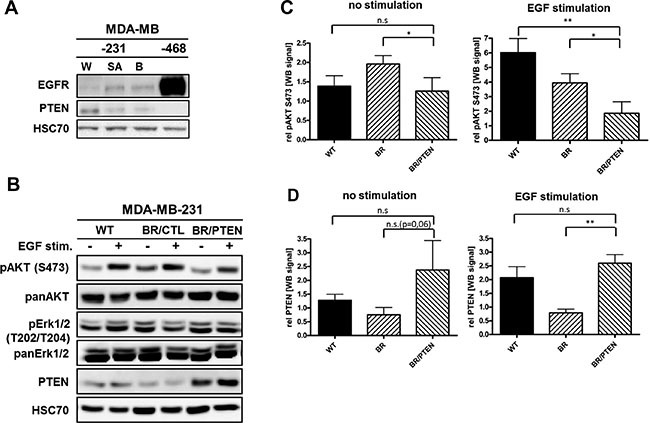
Figure 2. EGFR and PTEN expression in basal breast cancer cell lines.

(A) Immunoblot analysis of EGFR and PTEN in parental MDA-MB-231 (WT), its bone- (SA) as well as brain-seeking (BR) sublines and MDA-MB-468 (EGFR-amplified) cells. Protein levels of whole cell lysates were visualized by EGFR- and PTEN-specific antibodies. HSC-70 served as loading control (B) Immunoblot analysis of different PTEN pathway members in parental MDA-MB-231 (WT) cell line, brain-seeking (BR) sublines with either empty vector control (BR/CTL) or PTEN overexpression (BR/PTEN). Protein levels of whole cell lysates treated with 20 nM EGF (+) were compared to untreated cells (-) and visualized by antibodies specific for phosphorylated AKT (pAKT S473), total AKT (panAKT), phosphorylated Erk1/2 (pErk1/2 T202/T204), and total Erk1/2 (panErk1/2) and PTEN. HSC70 served as loading control. (C) Quantification of the pAKT S473 and (D) PTEN expression (both triplicate experiments) before and after EGF treatment. Samples were normalized to the corresponding HSC70 expression (Bars: SD. n.s.: not significant, *p < 0,05).
