
Figure 2. zfYB-1 protein expression in caudal fins.
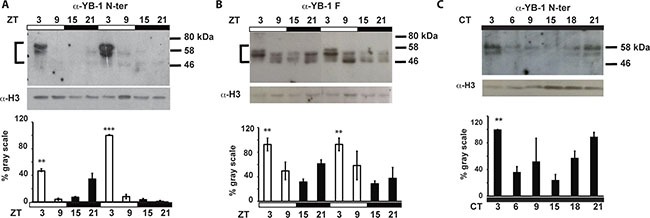
Western blot analysis and quantification of zfYB-1 levels in nuclear extracts under LD cycles (A, B) or during the second day in constant darkness, DD (C). The specific antibody used to detect YB-1 protein is indicated above each panel. An α-H3 antibody was used to provide a loading control. Vertical “brackets” on the left side of the panels A and B demarcate the YB-1 immunoreactive bands that were quantified using Image Lab™ Software. Quantification was expressed as % of gray scale relative to the highest peak of expression and is plotted on the Y-axes. Statistical significance between peak and trough points is indicated by asterisks where p < 0.05, p < 0.001 and p < 0.0001 are represented by *, ** and *** respectively. Results of the CircWave analysis are represented in Supplementary Table S1.