
Figure 4. hYB-1 expression in clock synchronized HEK293 cells.
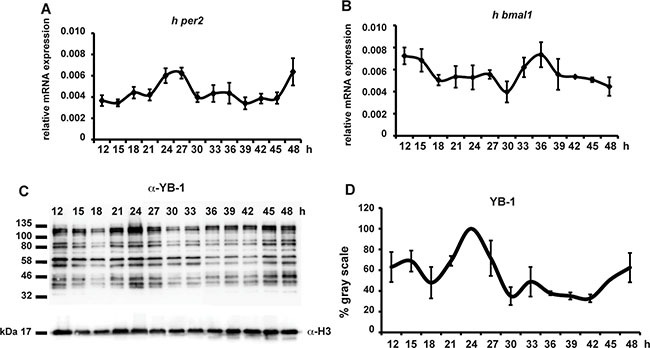
(A, B) Real time qRT-PCR analysis of hper2 and hbmal1 expression in HEK293 cells during 48 hours following transient treatment with 100 nM of Dexamethasone. Relative mRNA levels are plotted on the y-axis. Times after DEX treatment are plotted on the x-axis. Levels of h-gapdh mRNA were used for normalization. Results of the CircWave analysis are represented in Supplementary Table S1. (C) Western blot analysis using the α-YB-1 N-ter antibody in HEK293 cell nuclear extracts prepared after DEX treatment. H3 expression was used as a loading control. (D) Quantification analysis of panel (C). Quantification was expressed as % of gray scale relative to the highest peak time point (24 hrs) and plotted on the y-axis. Times after DEX treatment are plotted on the x-axis. The result of the CircWave analysis is represented in Supplementary Table S1.