
Figure 6. Regulation of zf Cyclin A2 expression by zfYB-1.
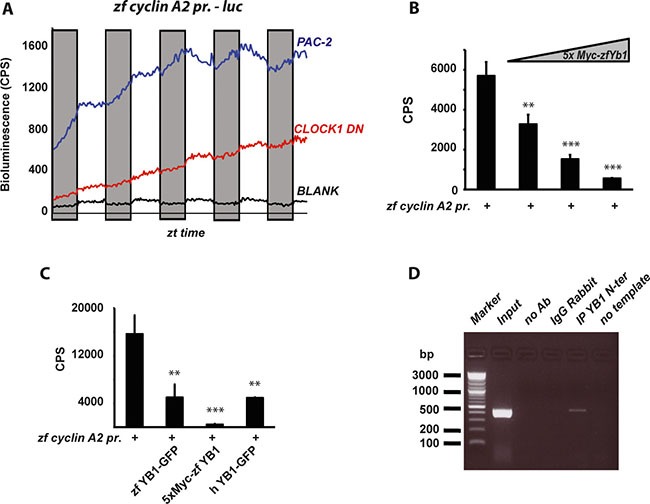
(A) Graphical representation of the real time bioluminescence assay results from PAC-2 (blue trace) and CLOCK1 DN cells (red trace) transfected with the cyclin A2 pr. luciferase reporter. The black trace (BLANK) represents the luminescence background of the cell plate. The bioluminescence in counts per second (CPS) is plotted on the y-axis and the ZT times on the x-axis. Results are plotted as the mean of 4 independent transfections. Gray bars indicate the corresponding dark periods. (B–C) In vitro luciferase assays in cells co-transfected with the cyclin A2 –pr. reporter and (B) 25, 50 and 100 ng of the 5xMyc-zfYB-1 expression vector or (C) with 50 ng of the zfYB-1-GFP, 5xMyc-zfYB-1 or the hYB-1-GFP expression vectors. Data are represented as means of triplicate samples +/– SD. At least three independent experiments were analyzed. Data were standardized for transfection efficiency using a β-galactosidase assay. Statistical significance is indicated above the graph by asterisks (*). (D) Agarose gel showing the 447 bp DNA promoter product amplified from ChIP assays using primers shown in Supplementary Table S2. Input and negative controls are indicated.