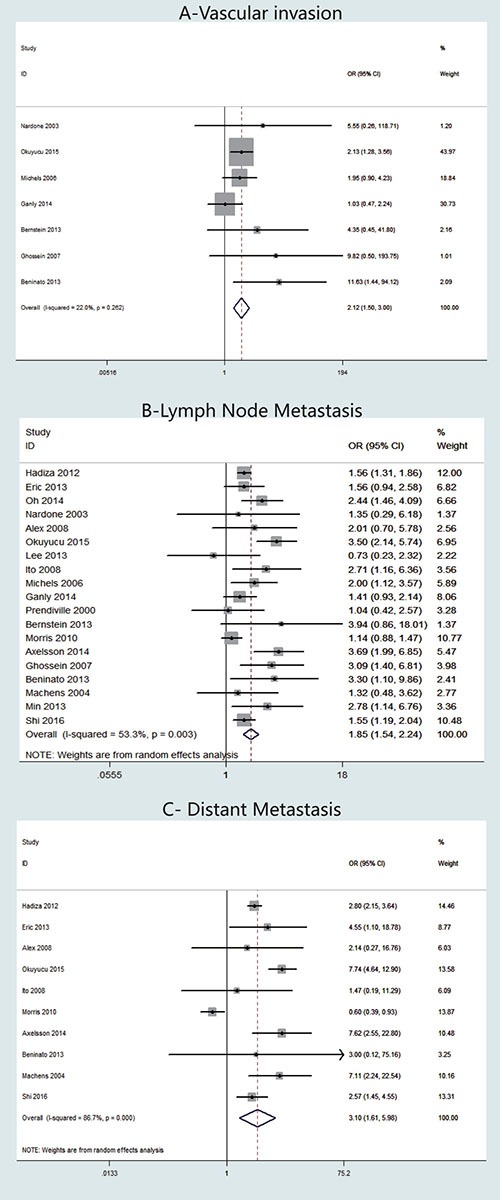
Figure 4.

Forest plots of odds ratios (ORs) for vascular invasion (Panel A), lymph node metastasis (Panel B) and distant metastasis (Panel C) associated with the tall cell variant (TCV) vs classic papillary thyroid cancer (cPTC). Each study is represented as a square and a horizontal line: the area of the square reflects the weight of the study in the meta-analysis, while the line represents the OR with its confidence interval. Diamonds represent the pooled ORs and their confidence interval.
