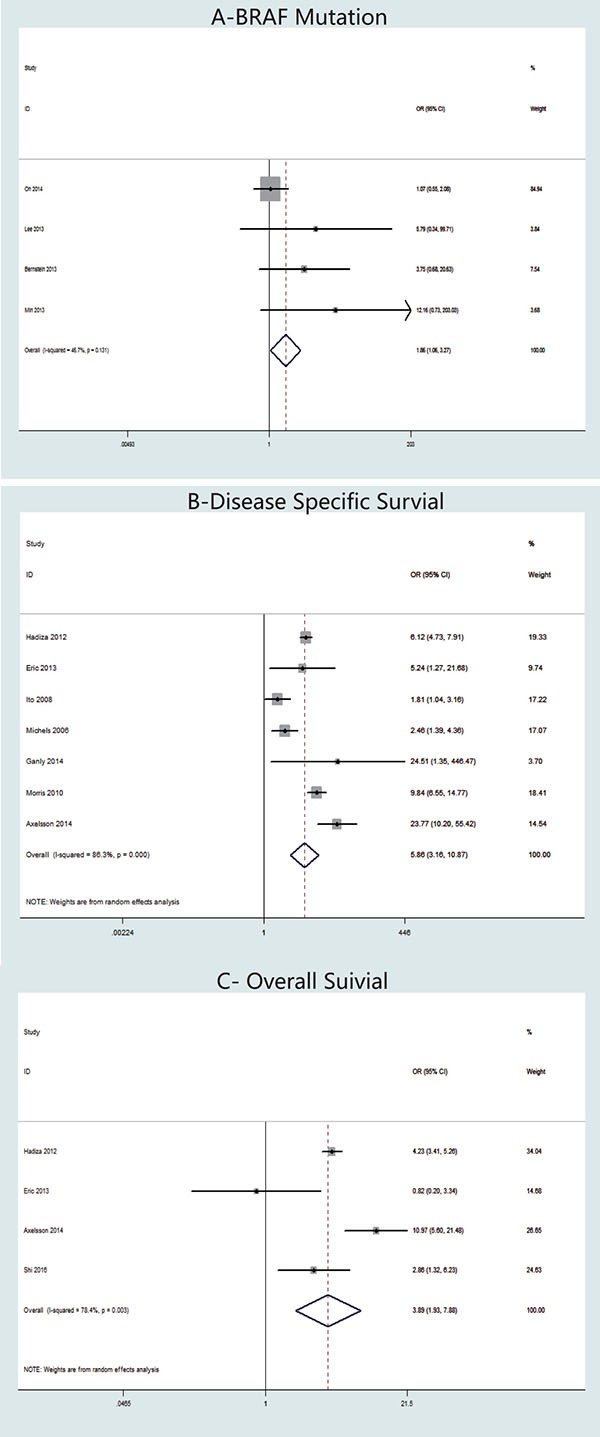
Figure 5.

Forest plots of odds ratios (ORs) for BRAF mutation (Panel A), disease-specific survival (Panel B) and overall survival (Panel C) associated with the tall cell variant (TCV) vs classic papillary thyroid cancer (cPTC). Each study is represented as a square and a horizontal line: the area of the square reflects the weight of the study in the meta-analysis, while the line represents the OR with its confidence interval. Diamonds represent the pooled ORs and their confidence interval.
