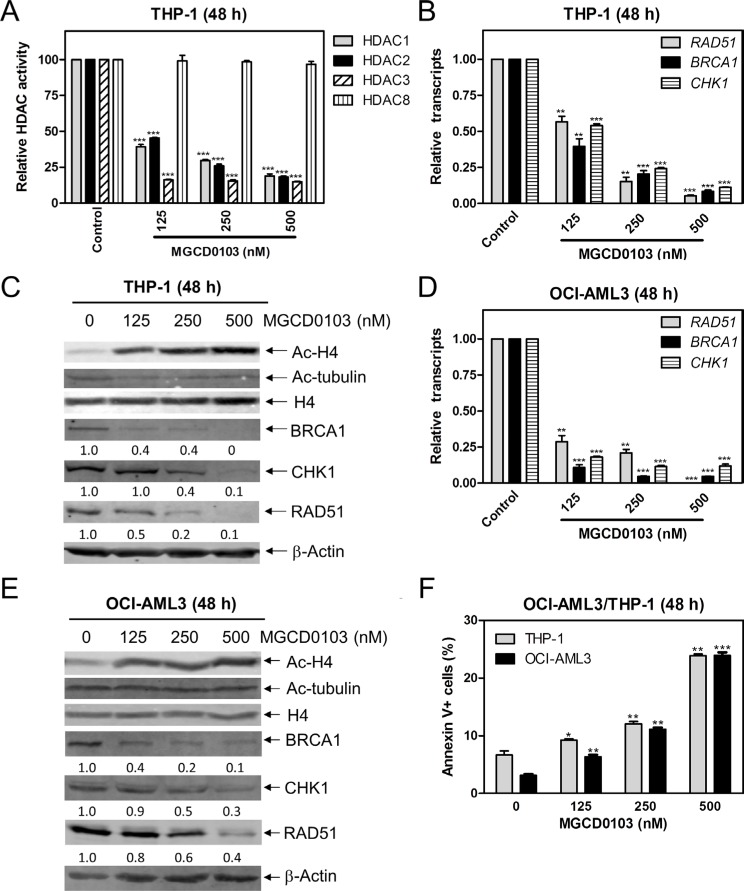
Figure 2. Inhibition of HDACs 1, 2, and 3 decreases the protein and transcript levels of BRCA1, CHK1, and RAD51, and induces apoptosis in AML cell lines.
(A) THP-1 cells were treated with variable concentrations of MGCD0103 for 48 h. Protein extracts were subjected to immunoprecipitation with antibodies against class I HDACs and then class I HDAC activities were measured, as described in the Materials and Methods. (B) THP-1 cells were treated with MGCD0103 for 48 h. Then total RNAs were isolated and gene transcript levels were determined by Real-time RT-PCR. Transcript levels were normalized to GAPDH and relative expression levels were calculated using the comparative Ct method. (C) THP-1 cells were treated with MGCD0103 for 48 h. Whole cell lysates were subjected to Western blotting and probed with the indicated antibodies. The fold changes for the densitometry measurements, normalized to β-actin and then compared to no drug treatment control, are indicated. (D) OCI-AML3 cells were treated with MGCD0103 for 48 h, then total RNAs were isolated from treated cells and gene transcript levels were determined by Real-time RT-PCR. Transcript levels were normalized to GAPDH and relative expression levels were calculated using the comparative Ct method. (E) OCI-AML3 cells were treated with MGCD0103 for 48 h. Whole cell lysates were subjected to Western blotting and probed with the indicated antibodies. (F) THP-1 and OCI-AML3 cells were treated with MGCD0103 for 48 h and then subjected to Annexin V-FITC/PI staining and flow cytometry analysis. *indicates p < 0.05, **indicates p < 0.01, and ***indicates p < 0.001 (panels A, B, D & F).

