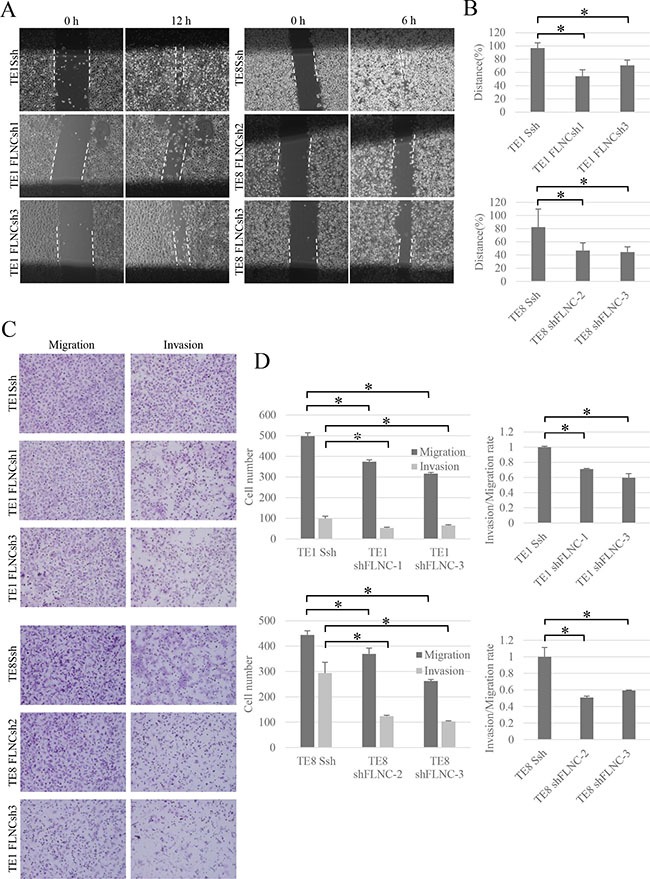
Figure 4. FLNC knockdown reduces cell migration and invasion activity.

(A) Effect of FLNC knockdown in wound healing assay (× 40). The pictures show cells at 12 hours in TE-1 linage and 6 hours in TE-8 linage after scraping. The dashed lines indicate the border of the cell free area. (B) The bar graphs indicate the widths of the cell free area of each cell type. FLNC knockdown inhibited cell migration significantly in both TE-1 and TE-8 cells. Columns represent three independent replicates and bars indicate SD. *P < 0.01, significantly different from SshRNA infected cells. (C) The transwell migration and invasion assay (× 200) was used to examine the effect of FLNC knockdown on cell migration and invasion activity. (D) Quantification of migration and invasion abilities of FLNC knockdown cells. The numbers of migratory and invasive cells in the FLNC knockdown cells were significantly less than in control cells. The invasion/migration rate of FLNC knockdown cells was also significantly less than the control cells. Columns represent total cell number in five independent microscopic fields and bars indicate SD. *P < 0.01, significantly different from the number of SshRNA infected cells.
