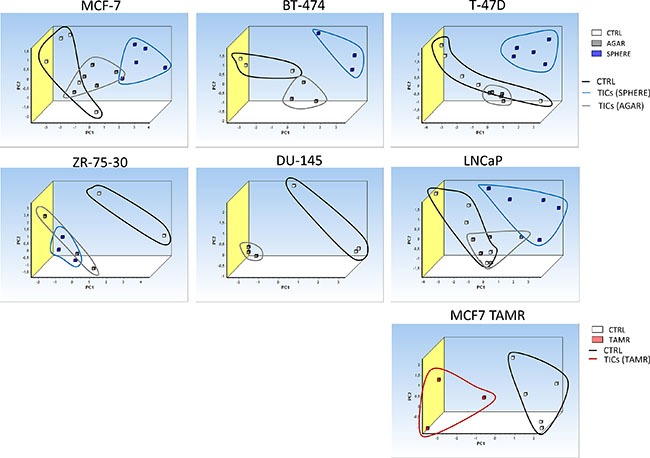
Figure 9. Principal component analysis (PCA) discriminates tumor-initiating cells (TICs) from cancer cells based on gene expression of the selected iron metabolism-related genes (Aco1, Abcb10, Cybrd1, Epas1, Glrx5, Heph, Hfe, Ireb2, Qsox1 and Tfrc).

Principal component analysis (PCA) based on selected iron metabolism-related genes was run on malignant breast MCF-7, BT-474, T-47D, ZR-75-30 and malignant prostate DU-145 as well as LNCaP cell lines using the GenEx software which was also used for plotting the PCA. White squares depict control conditions, grey show agar conditions, blue boxes show sphere conditions and red boxes show TAMR cells. Individual clusters were also highlighted with corresponding lines using identical colors.
