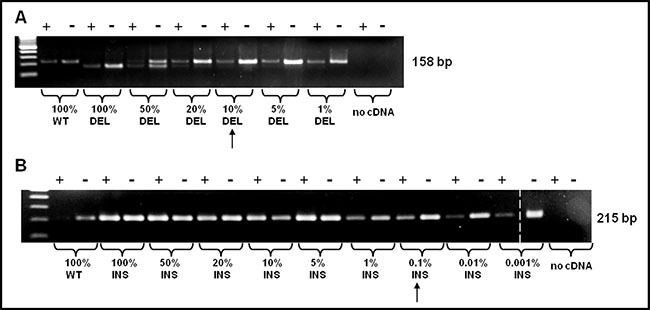
Figure 3. PNA directed PCR clamping sensitivity was assessed mixing, at different ratio, mutated (type-1 and type-2) and WT template.

The arrows indicate the sensitivity of the method. (A) Dilutions were as follow: 100, 50, 20, 10, 5, 1% CALR type-1 mutation vs. WT template and (B) 100, 50, 20, 10, 5, 1, 0,1, 0,01, 0,001% CARL type-2 mutation vs. WT template. The dashed vertical bar separates different parts of the same gel.
