
Figure 2. Apoptosis induction in HCT116 and SW620 cells by PS-PDT.
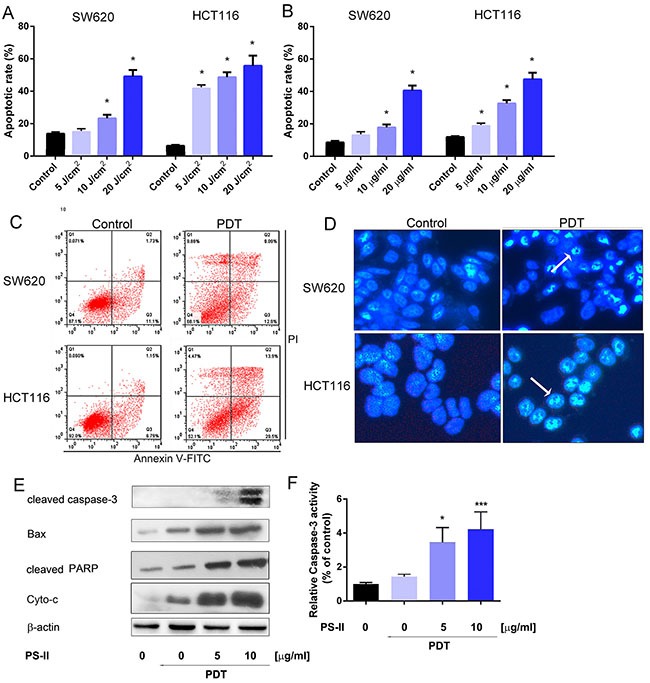
The apoptotic rate in HCT116 and SW620 cells was determined 24 h after treatment with various doses of light irradiation with a fixed PS-II (10 μg/ml) (A) or different concentrations of PS-II with a fixed intensity (5 J/cm2) (B). (C) FACS analysis of apoptosis in HCT116 and SW620 cells after treated with 10 μg/ml PS-II and 5 J/cm2 light irradiation. (D) Hoechst staining and analysis of the condensed nuclei by fluorescence microscopy (200 × magnification). Apoptotic cells are shown in blue and the peripherally clumped or fragmented chromatin is indicated by arrows. (E) Western blot analysis of cleaved Caspase-3, Bax, cleaved PARP and Cyto-c (cytochrome C). β-actin was used as a control. (F) The relative activity of caspase-3 was detected in different groups by using ELISA kit. Data are expressed as mean ± sd of three independent experiments. *p < 0.05, ***p < 0.01 vs. untreated control (HCT116 or SW620).