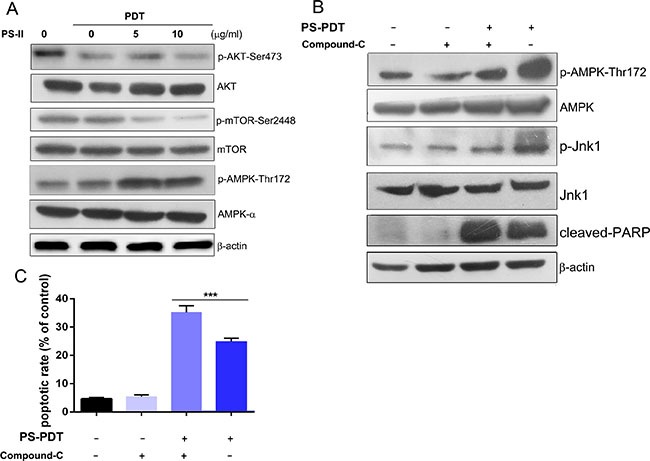
Figure 4. Analysis of AMPK activation and AKT/mTOR pathway inhibition in PS-PDT-treated SW620 cells.

The SW620 cells were treated with 5 mg/L and 10 mg/L PS with illumination of 5J/cm2 and were incubated for 24 h. (A) Western blot analysis of the phosphorylation of AKT-Ser473, AMPK-Thr172 and mTOR-Ser2448. The total protein of AKT, AMPK and mTOR are also shown. (B) Western blot analysis of the phosphorylation of AMPK (Thr172), Jnk1 (Thr183/Tyr185), cleaved PARP was shown after the AMPK specific inhibitor compound C treatment the phosphorylation of AMPK that was induced by PS-PDT. (C) Apoptosis in SW620 cells after PS-PDT treatment in combination with compound C was analyzed using Annexin V-FITC/PI staining. ***p < 0.01 compared with untreated control group. The data are expressed as mean ± sd from the results of three independent experiments.
