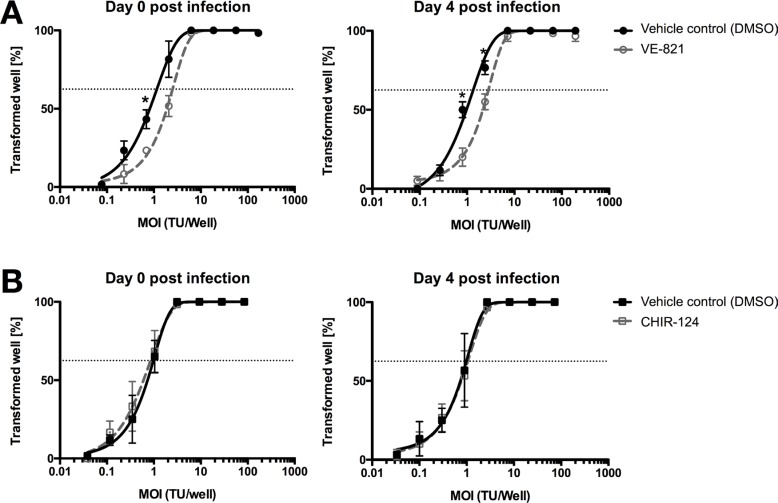
Figure 6. ATR inhibitor reduces EBV's B-cell transformation efficiency.
(A) Quantification of B-cells outgrowth following tonsillar mononuclear cells (TMCs) infection with EBV-95.8 (3 fold serial dilution) in presence of vehicle control (0.01% of DMSO - black line) or 1 μM VE-821 ATR inhibitor (dottet-grey line) added at day 0 or 4 post EBV inoculation. (B) Quantification of B-cells outgrowth following TMCs in presence of vehicle control (0.01% DMSO - black line) or 10 nM of CHIR-124 Chk1 inhibitor (dotted-grey line) added at day 0 or 4 post EBV inoculation. The number of transformed wells is plotted relative to the transforming units (TU) of EBV-B95.8 per well. Results shown are from 3 donors and are presented as mean ± SEM. For both figure (A) and (B) two EBV positive and one EBV negative donors were used. Dotted lines represent 62.5% positive wells. Based on a Poisson distribution this percentage represents the probability of B-cells outgrowth knowing that a viral particle is present in every well. *= p < 0.05 (Unpaired t-Test).

