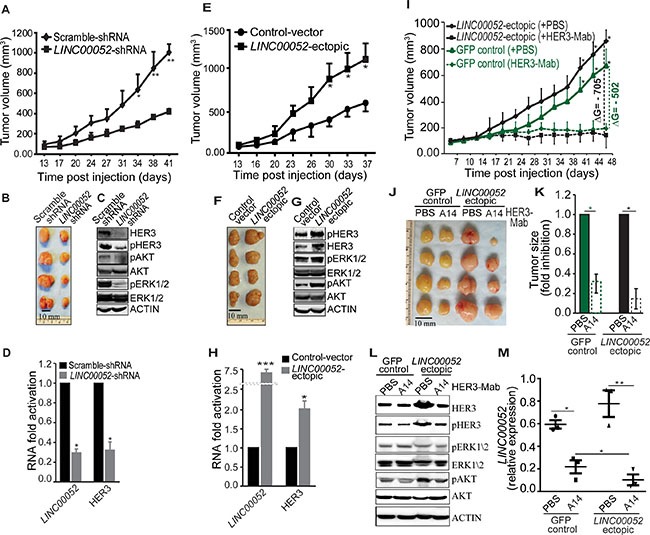
Figure 5. Functions of LINC00052 in breast tumor xenograft models.

(A–D) Female immunodeficient nude mice received subcute (sc) injection of 5×10⁶ MCF7 cells stably expressing LINC00052 silenced or negative control constructs. Tumor volumes, measured twice a week, were plotted over time (A). End-point experiment 6-weeks tumors are shown (B). Immunoblotting analysis of xenograft whole tissue extracts for HER3, pHER3, pAKT, AKT, pERK1/2, ERK1/2 and ACTIN (C). RNA analysis for LINC00052 and HER3 levels in the whole tissue extract of xenografts (D). (E–H) Tumor growth in mice bearing MCF7 xenografts from cells stably expressing LINC00052-ectopic or control constructs; volume (mm3) plotted over time (E). End-point experiment 6-week tumors are shown (F). Immunoblotting analysis of xenograft whole tissue extracts for HER3, pHER3, pAKT, AKT, pERK1/2, ERK1/2 and ACTIN (G). Quantitative-RT-PCR evaluation of LINC00052 and HER3 RNA expression in the whole tissue extract of xenografts (H). (I–M) In vivo HER3-antibody treatment of nude mice bearing MCF7 xenografts of cells stably expressing LINC00052-ectopic or control GFP constructs. Two cohorts of SCID mice with size-matched tumors (n = 6/group) received 10 μg/gram of mouse weight per dose of HER3-Mab or negative control-PBS. Treated mice and controls received a series of doses (n = 9) through intraperitoneal (i.p.) administration twice weekly. Tumor volumes, measured before each administration, were plotted over time (I), and representative tumors at the experimental end-point are shown (J). Evaluation of the change of tumor growth, expressed as ΔG = (average of tumor size treated with HER3-Mab average of tumor size treated with control-PBS) (K). Immunoblotting analysis of xenografts whole tissue extracts for HER3, pHER3, pAKT, AKT, pERK1/2, ERK1/2 and ACTIN (L). Quantitative RT-PCR evaluation of LINC00052 and HER3 RNA expression in the whole tissue extract of xenografts (m). In each experiment, 5-6 mice per group were treated. Mean ± SD is shown. *p < 0.05, **P < 0.01.
