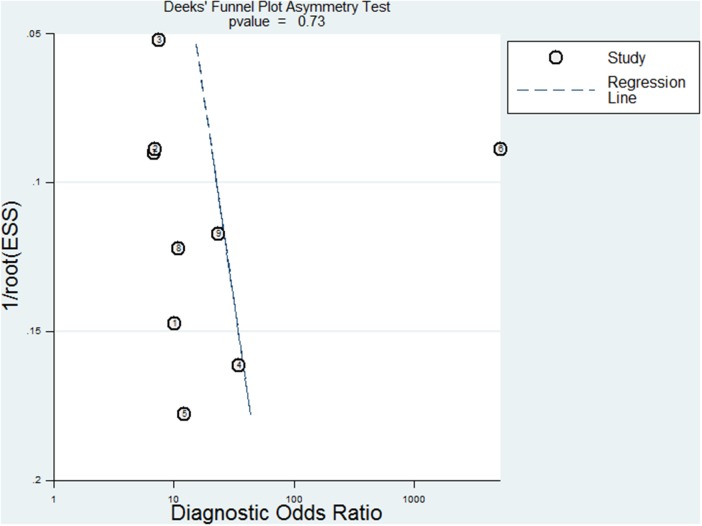
Figure 5. Deek's plots for the assessment of publication bias.
The funnel graph plots the log of the diagnostic odds ratio (DOR) against the standard error of the log of the DOR (an indicator of sample size). Solid circles represent each study in the meta-analysis. The line indicates the regression line.

