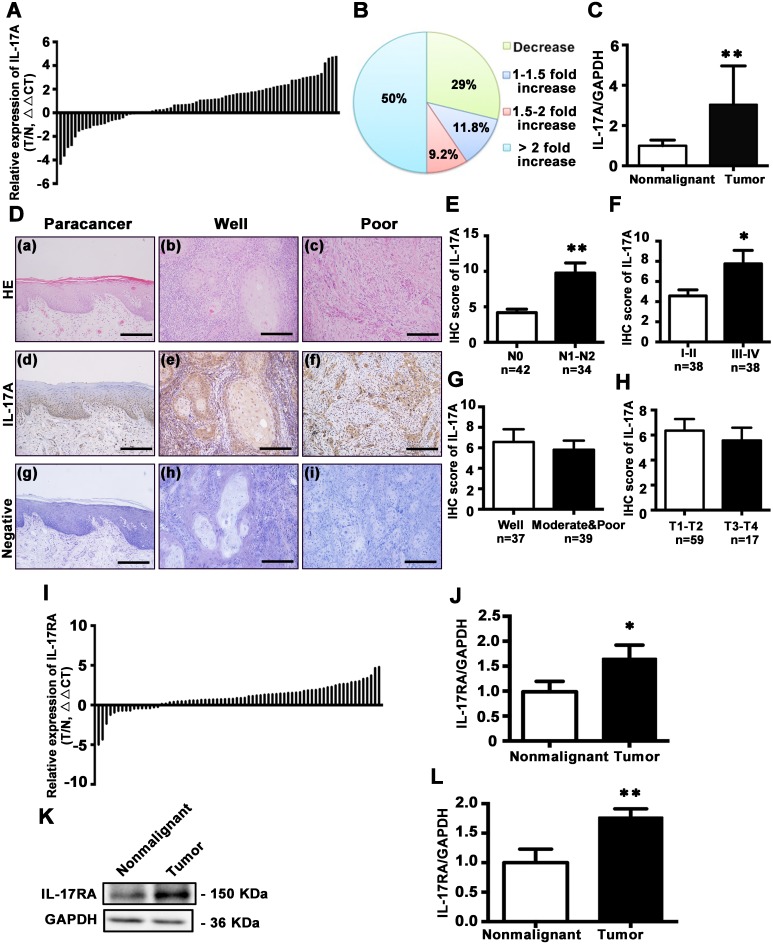
Figure 2. Expression and distribution of IL-17A and its receptor IL-17RA in tongue tissues.
A. Relative expression of IL-17A in 76 pairs of TSCC specimens and adjacent nonmalignant tissues was examined by qRT-PCR. Data were presented as relative fold change (ΔΔCT values, TSCC/Nonmalignant). B. IL-17A expression levels from tumors were normalized to their corresponding control and the percentage of cases for the indicated fold expression in the tumor represented as a pie chart. C. Relative IL-17A levels for 76 specimens of TSCC and its counterparts. Data were presented as relative mRNA fold change. D. Hematoxylin and eosin staining for paracancerous epithelium (a), well- (b), and poor-differentiated tumors (c). Immunohistochemical staining with anti-IL-17A antibody to characterize the expression and distribution of IL-17A in paracancerous epithelium (d), well- (e) and poor-differentiated tumors (f). Nuclei were counterstained with hematoxylin (blue). Primary antibody was omitted in negative controls (g, h, i). Scale bars: 200 μm. E. IHC scores of IL-17A expression based on lymph node metastasis. F. IHC scores of IL-17A expression based on clinical stages. G. IHC scores of IL-17A expression based on TSCC histological grade. H. IHC scores of IL-17A expression based on tumor size. I. Expression of IL-17RA in 72 pairs of TSCC and adjacent nonmalignant tissues was quantified by qRT-PCR. Data were presented as relative fold change (ΔΔCT values). J. Relative mRNA change of IL-17RA in TSCC and its counterparts. K. Representative western blot of IL-17RA in TSCC tissues and its counterparts. L. Quantitative analysis of IL-17RA protein expression based on western blot analysis of 36 pairs of TSCC and paracancer tissues. *P < 0.05, **P < 0.01.

