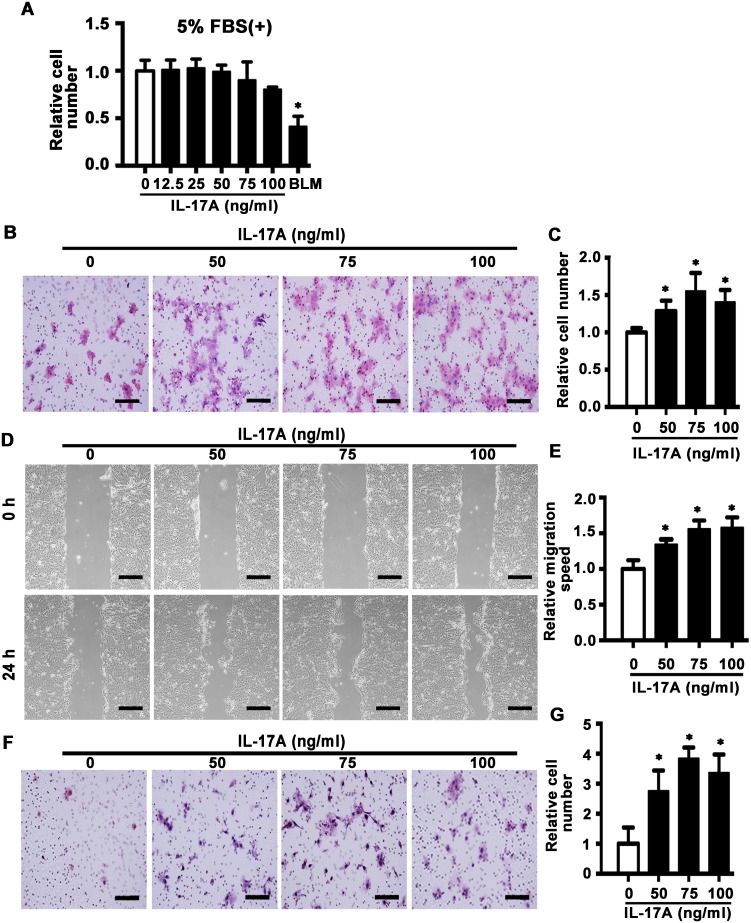
Figure 3. IL-17A promotes cell migration and invasion of SCC15 cells.
A. SCC15 cells were cultured with IL-17A from 12.5 to 100 ng/ml. The proliferation rate was detected by MTS assay 48 h after treatment. Bleomycin (BLM, 10 μg/ml) was used as positive control. B. Representative images of cell migration at 24 h. C. Histogram showing cell migration expressed as relative number of the whole migratory cells on the bottom side of the membrane. D. Representative images of wound-healing assay at 0 and 24 h. E. Histogram showing cell migration expressed as relative wound edges movement. F. Representative images of cell invasion at 24 h. G. Histogram showing cell invasion expressed as relative number of the whole invaded cells on the bottom side of the membrane. Values are presented as mean ± SEM from three independent experiments. Scale bars: 200 μm, *P < 0.05 compared with the untreated cells.

