
Figure 5. Kaplan–Meier survival curves were stratified by HOTTIP expression level in breast cancer patients.
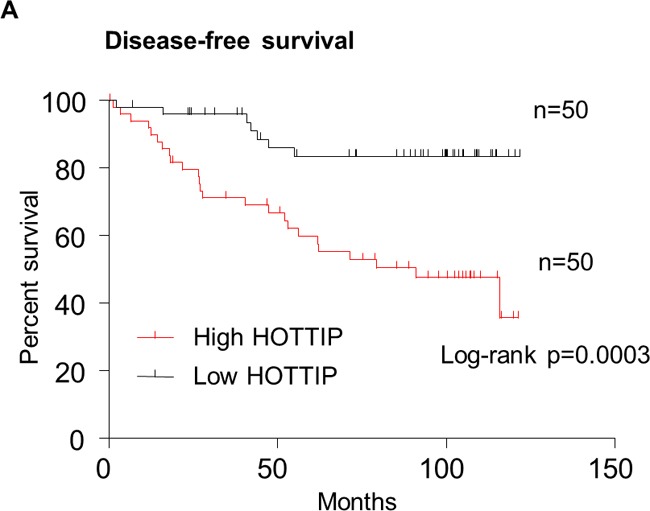
Patients in high HOTTIP group showed decreased disease-free survival (DFS, A) and overall survival (OS, B), as compared with low HOTTIP group, p = 0.0003 and p = 0.0139, respectively. The p value was calculated using the log-rank test.