
Figure 2. Relapse-free survival of stage II CRC.
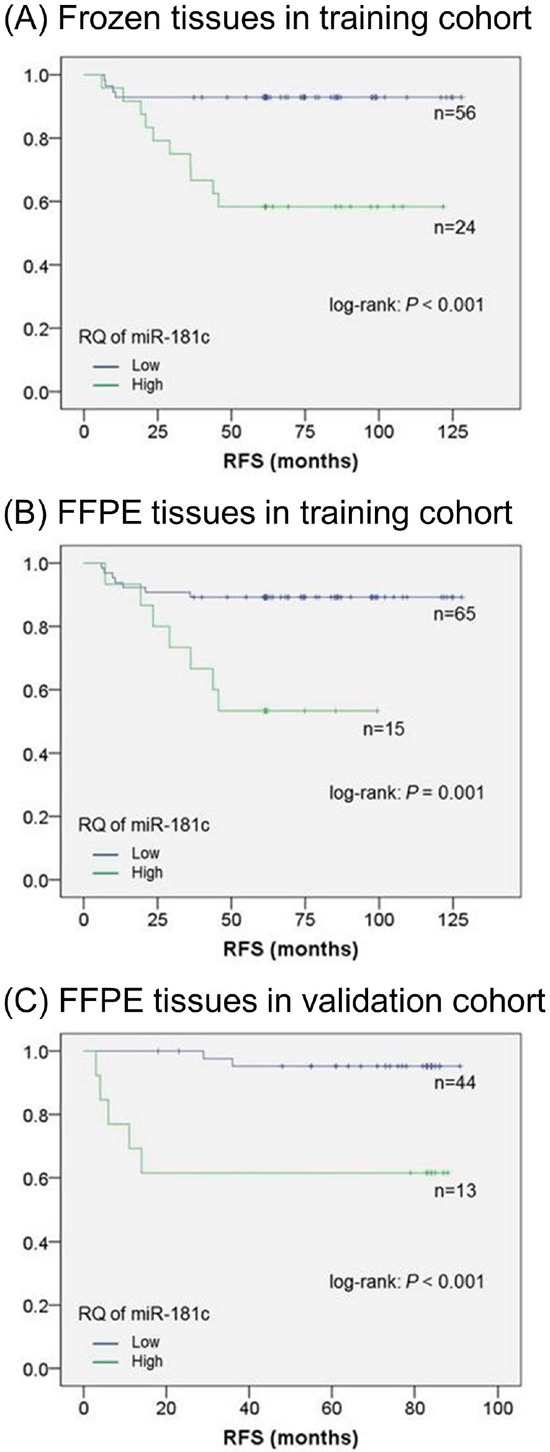
A. Kaplan–Meier method for the two groups in the training cohort using frozen tissue that showed both higher and lower miR-181c expressions. The threshold was established using the ROC curve and Youden index. RFS was significantly worse for the patients with higher miR-181c expression than for those with lower miR-181c expression of. B. Kaplan–Meier method for the two groups in the training cohort using FFPE tissue that showed both higher and lower miR-181c expressions. The threshold was established using the ROC curve and Youden index. RFS was significantly worse for the patients with higher miR-181c expressions than for those with lower miR-181c expressions. C. Kaplan–Meier method for the two groups in the validation cohort that showed both high and low miR-181c expressions. The threshold was 0.010, which was established in the training cohort. RFS was significantly worse for the patients with higher miR-181c expression than for those with lower miR-181c expressions. The differences were analyzed by log-rank test. P < 0.05 denotes a statistically significant difference.