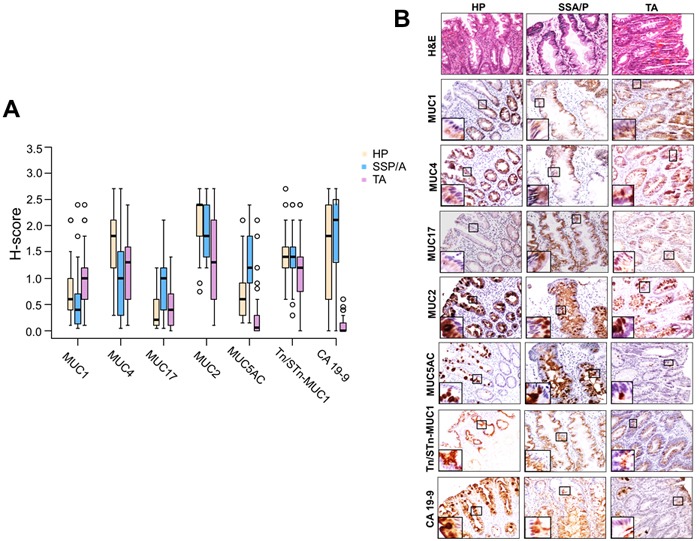
Figure 1. Immunohistochemical expression of mucins and associated O-glycans in colorectal polyps.

A. Box plots representing the H-score for mucins (MUC1, MUC4, MUC17, MUC2, and MUC5AC) and O-glycans (CA19-9, Tn/STn-MUC1) expression in HP, SSA/P and TA. A significant downregulation of MUC4 (p = 0.0066), significant upregulation of MUC17 (p = 0.0002) and MUC5AC (p < 0.0001) was observed in SSA/P cases in comparison to HP cases. The box plots further show that compared to SSA/P in TA cases, MUC1 expression was significantly increased (p = 0.0005) while there was a significant decrease in expression of MUC17 (p = 0.0054), MUC2 (p = 0.02), MUC5AC (p < 0.0001) and CA19-9 (p < 0.0001). B. The HP, SSA/P, and TA tissue specimens were probed with MUC1 (mouse monoclonal-HMFG2), MUC4 (mouse monoclonal-8G7), MUC17 (rabbit polyclonal-SN-1139-2), MUC2 (rabbit monoclonal-EPR6145), MUC5AC (mouse monoclonal-45M1), CA19-9 (mouse monoclonal-NS 19.9), and Tn/STn-MUC1 (mouse monoclonal-5E5) antibodies after non-specific blocking with horse serum. All the tissue sections were examined under a microscope, and the expression was evaluated on basis of reddish brown staining by a pathologist. Representative photomicrographs (20X) of Hematoxylin & Eosin staining, mucins (MUC1, MUC4, MUC17, MUC2, and MUC5AC), and O-glycans (Tn/STn-MUC1 and CA19-9) stained tissues of HP, SSA/Ps, and TA were taken. For uniformity, images for all the mucins and O-glycans staining were taken from the same area in a sample of HP, SSA/P and TA respectively. Magnified images in inset shows expression of respective mucins in different cellular compartments. MUC1 expression was significantly high (p = 0.0005) in TA in comparison to HP and SSA/P. Strong expression of MUC4 was observed in adjacent normal colon. Expression of MUC4 was significantly reduced in SSA/P (p = 0.0066) compared with HP. Significantly high immunoreactivity of MUC17 was observed in SSA/P lesions compared to HP and TA. Compared to HP and SSA/P, MUC2 expression was significantly reduced in TA (p = 0.0018, and 0.020 respectively). MUC5AC expression was significantly high in HP and SSA/P compared to TA (p < 0.0001). HP, SSA/P, and TA expressed Tn/STn-MUC1 at similar levels. CA19-9 expression was significantly high in HP (p < 0.0001) and SSA/P (p < 0.0001) compared to TA. NC: adjacent normal colon; HP: hyperplastic polyps; SSA/P: sessile serrated adenoma/polyps; TA: tubular adenoma.
