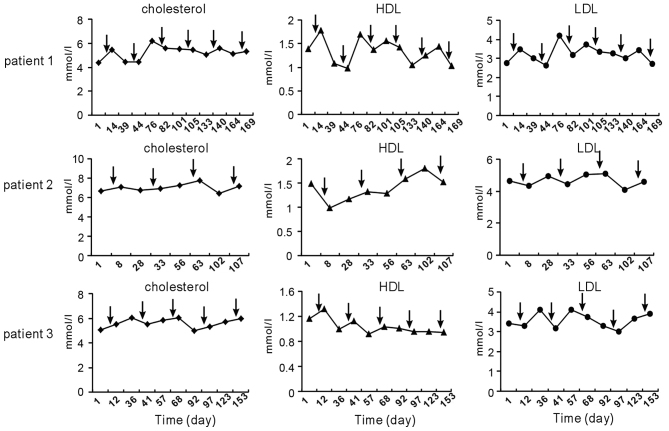
Figure 2.
Serum cholesterol, HDL and LDL levels before and after TP chemotherapy in patients 1–3. Arrows indicate the time-points of TP chemotherapy. The fluctuation trend of cholesterol, HDL and LDL after chemotherapy was dissimilar to that of triglycerides. Normal range: cholesterol, 2.8–5.7 mmol/l; HDL >0.9 mmol/l; LDL <4.0 mmol/l. HDL, high-density lipoprotein; LDL, low-density lipoprotein; TP, paclitaxel and cisplatin.

