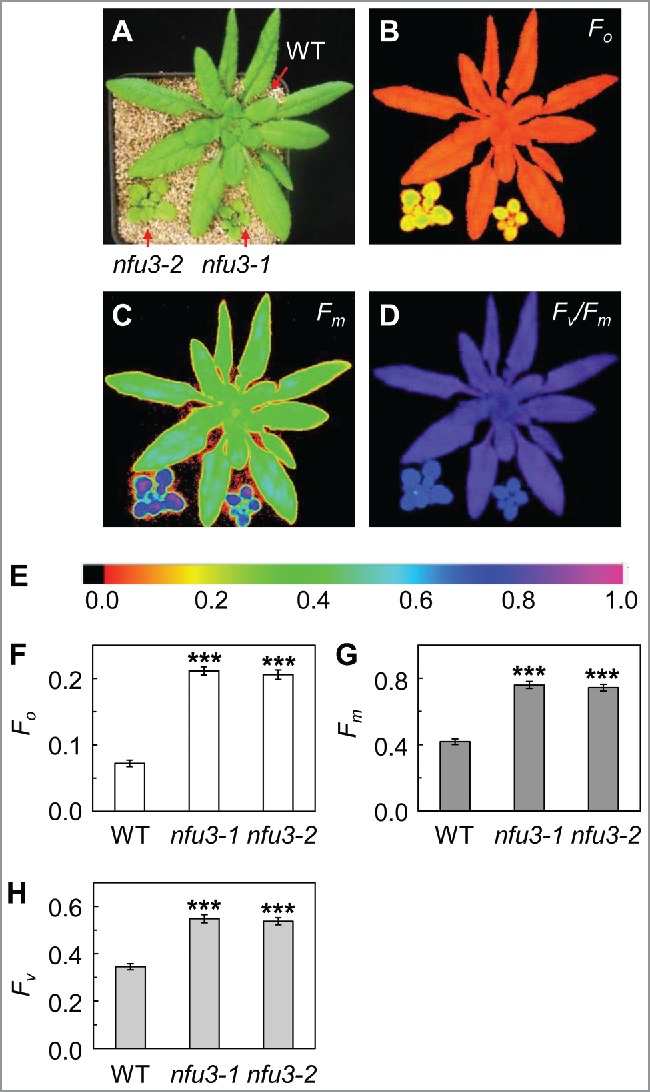
Figure 2.

Minimal and maximal fluorescence were increased in the nfu3 mutants. (A) Images of 4-week-old wild-type, nfu3–1, and nfu3–2 plants. (B-D) False-color Fo, Fm, and Fv/Fm images of 4-week-old plants, respectively. (E) Color scale for chlorophyll fluorescence parameters F0, Fm, and Fv/Fm in B-D. F-H, Fo, Fm, and Fv values of 4-week-old plants. Data are presented as mean ± SE (n = 4). The asterisk indicates a significant difference between the mutant and the wild type (WT) (Student's t test; *, p < 0.05; **, p < 0.01; ***, p < 0.001). Plants used for chlorophyll fluorescence analysis were grown on a 12-h light/12-h dark photoperiod with an irradiance of 150 μmol photons m−2 s−1 during the light period.
