
Figure 1.
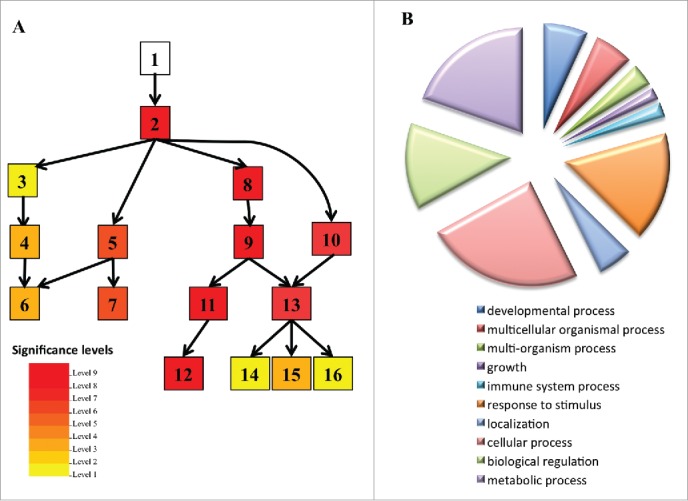
GO analysis of microarray data for biologic process categories. (A) Singular enrichment analysis of the genes with higher expression in UBP1b-ox plants under non-stressed and heat stress conditions. Analysis was performed using AgriGO (http://bioinfo.cau.edu.cn/agriGO/). The box colors indicate the level of statistical significance. 1, GO:0008150 biologic process; 2, GO:0050896 response to stimulus (p = 2.6e−28); 3, GO:0009628 response to abiotic stimulus (p = 5.4e−6); 4, GO:0009266 response to temperature stimulus (p = 7e−8); 5, GO:0006950 response to stress (p = 4.3e−14); 6, GO:0009409 response to cold (p = 2.4e−8); 7, GO:0006952 defense response (p = 5.1e−13); 8, GO:0042221 response to chemical stimulus (p = 8.1e−22); 9, GO:0010033 response to organic substance (p = 8.4e−26); 10, GO:0009719 response to endogenous stimulus (p = 2.6e−13); 11, GO:0009743 response to carbohydrate stimulus (p = 1.5e−20); 12, GO:0010200 response to chitin (p = 3.9e−21); 13, GO:0009725 response to hormone stimulus; 14, GO:009737 response to abscisic acid stimulus (p = 2.6e−13); 15, GO:009733 response to auxin stimulus (p = 5e−7); 16, GO:0032870 cellular response to hormone stimulus (p = 2.6e−13). (B) GO biologic process classification of 1,103 genes with higher expression in UBP1b-ox under non-stressed and heat stress conditions. GO-analysis was performed using the Gene Ontology tool (http://pantherdb.org).