
Figure 4.
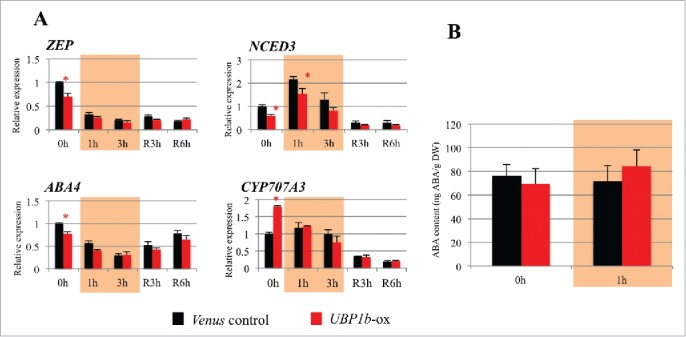
Expression level of ABA biosynthesis- and catabolism-related genes and endogenous ABA level in UBP1b-ox plants. (A) RT-qPCR analysis of the expression levels of ABA metabolism-related genes in UBP1b-ox and control plants. RT-qPCR analysis of ZEP, NCED3, ABA4, and CYP707A3 expression was performed using the RNA of plant samples collected under non-stress condition (0h), 1 hour and 3 hour treatment with 40°C (1h and 3h), and under recovery at 22°C for 3 hour and 6 hour (R3h and R6h). Data represent the mean ± sd. n = 3. An asterisk indicates a significant difference (p < 0.05) between UBP1b-ox and control plants as determined by a t-test. (B) Endogenous ABA level in UBP1b-ox and control plants under non-stressed and heat stress conditions. Data represent the mean ± sd. n = 6.