
Figure 5.
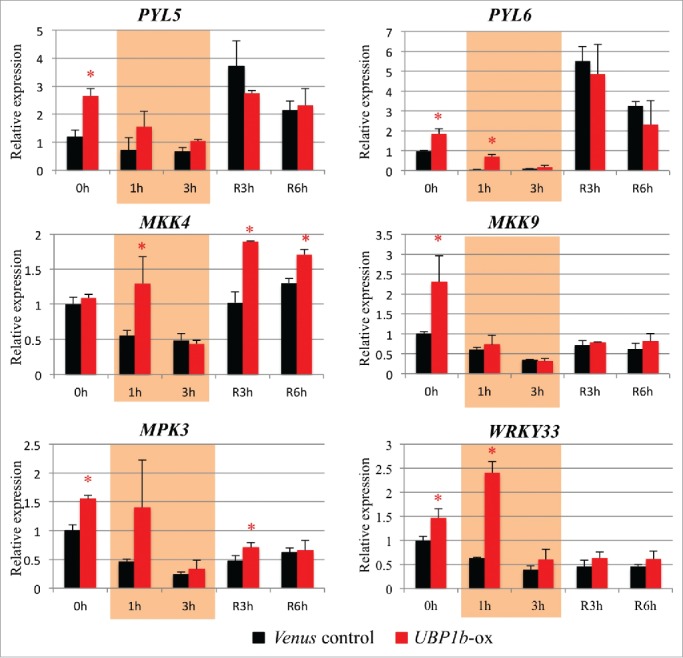
Expression level of UBP1b target candidates. (A) RT-qPCR analysis of target candidate genes was performed in UBP1b-ox and control plants under non-stressed and heat stress conditions; PYL5, PYL6, MKK4, MKK9, MPK3, and WRKY33. Data represent the mean ± sd. n = 3. An asterisk indicates a significant difference (p < 0.05) between UBP1b-ox and control plants as determined by a t-test.