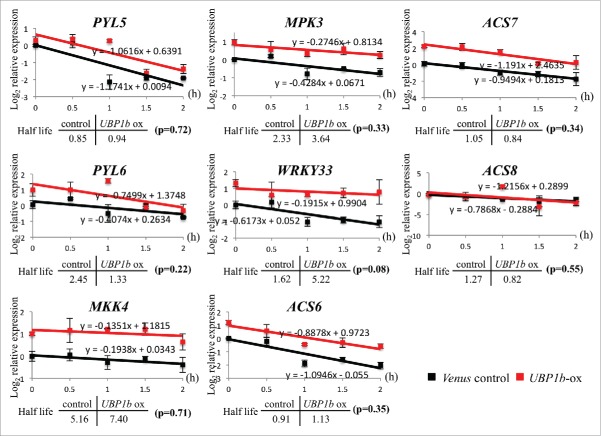
Figure 6.
RNA decay assay of UBP1b target candidates. RNA decay rate of target candidate genes were checked in UBP1b-ox and control plants; PYL5, PYL6, MKK4, MPK3, WRKY33, ACS6, ACS7, and ACS8. Data represent the normalized log2 value of gene expression during cordycepin treatment. Data represent the mean ± sd. n = 3. F-test was performed to compare the RNA decay rate between parallel linear recognition model and individual linear recognition model and the p-value for each target candidate gene is shown within parenthesis.

