
Figure 7.
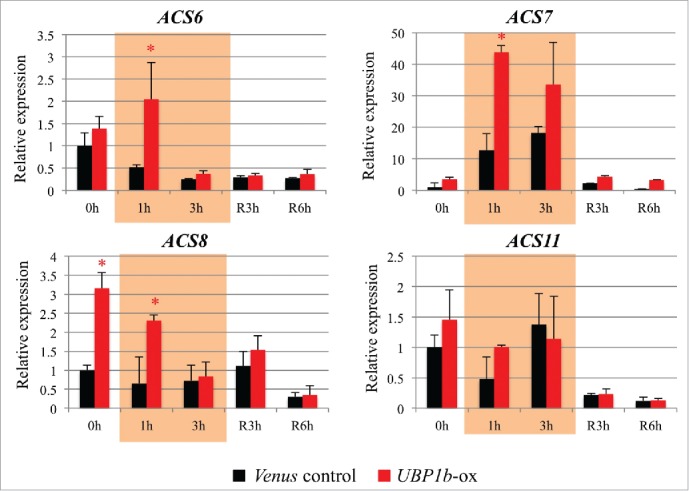
Expression level of ethylene biosynthesis-related genes. RT-qPCR analysis of ACS6, ACS7, ACS8, and ACS11 in UBP1b-ox and empty vector, control (Venus) plants under non-stressed and heat stress conditions. Data represent the mean ± sd. n = 3. An asterisk indicates a significant difference (p < 0.05) between UBP1b-ox and control plants as determined by a t-test.