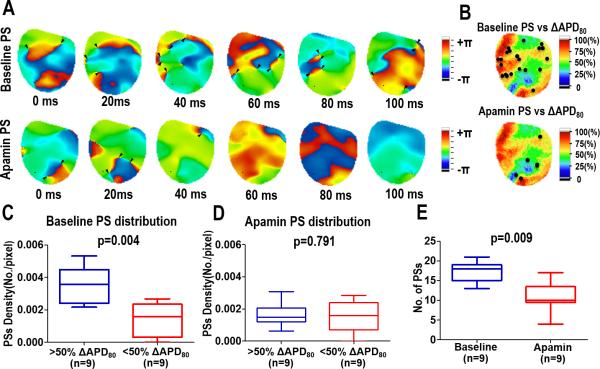
Figure 2.
Effects of apamin on phase singularities during VF in heart failure. (A) Consecutive phase maps sampled at 20 ms intervals during VF at baseline (top) and after apamin (bottom). Phase singularities are indicated by black arrowheads. (B) Correlation of spiral waves (rotor) to ΔAPD. Summary data showing the correlation of the density of PS at baseline (C) and after apamin (D) to ΔAPD. (E) Summary data showing the overall effect of apamin on the number of PS.

