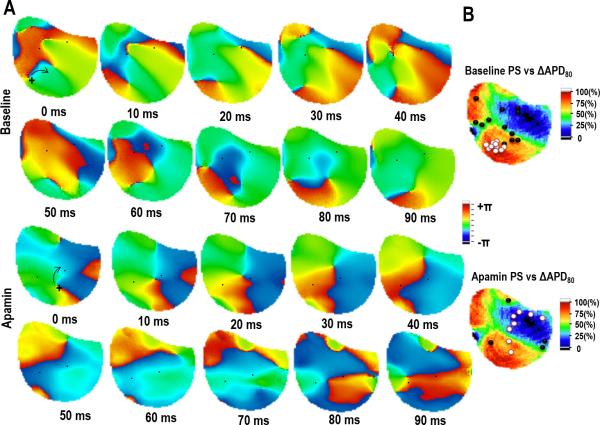
Figure 4.
Tracking the location of phase singularities from a reentrant spiral wave. (A) PS associated with a reentrant spiral wave at baseline (top panels) and after apamin (bottom panels). The PS is tracked for 90 ms showing the stability of the PS. (B) Summary data showing the location of the PS during the reentrant spiral wave correlated to the change in APD80 with apamin. White dots indicate the PS associated with the spiral wave. Black dots indicate PS associated with wave break.

