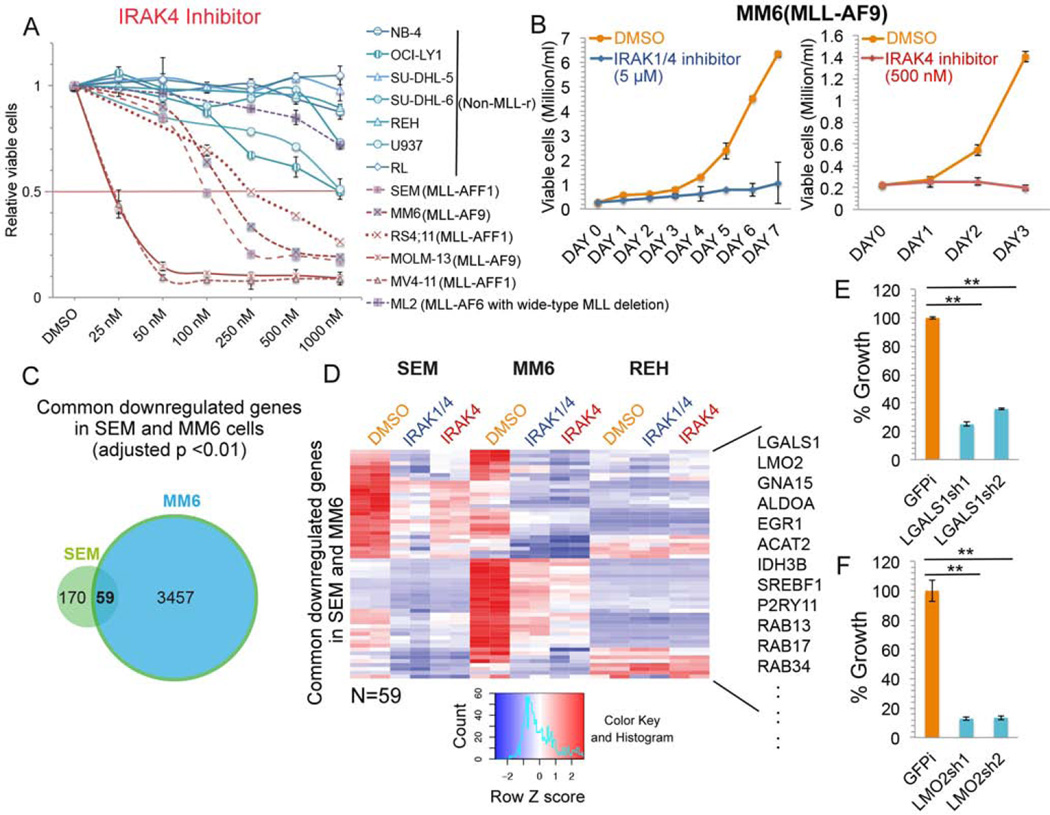
Figure 5. Determinants of the increased sensitivity of MLL leukemia cells to IRAK inhibition.
(A) IRAK4 inhibitor-specific inhibition of MLL leukemia cell proliferation. Multiple MLL leukemia and non-MLL leukemia or lymphoma cell lines were cultured with different doses of IRAK4 inhibitor for 3 days. Data are represented as Mean ± SD (n=3).
(B) Cell growth of MLL-AF9 positive AML MM6 cells is inhibited by IRAK inhibition. Data are represented as Mean ± SD (n=3).
(C) Venn diagram analysis identifies 59 common downregulated genes by both IRAK inhibitors in MLL-AFF1 SEM and MLL-AF9 MM6 cells. P value was determined with the hypergeometric test.
(D) Hierarchical clustering of the 59 common genes downregulated in SEM and MM6 cells after IRAK inhibition. Some examples of common downregulated genes are indicated to the right.
(E–F) Depletion of LGALS1 and LMO2 results in reduced growth of MM6 cells. MM6 cells were transduced with shGFP control (GFPi) or two different lentiviral shRNA constructs. After selection with puromycin for 4 days, viable cells were seeded at 0.2 million/ml and cultured for 3 more days before cell viability counting. Data represent the Mean ± SD (n=3). **, p<0.005, One-Way ANOVA.
See also Figures S5.

