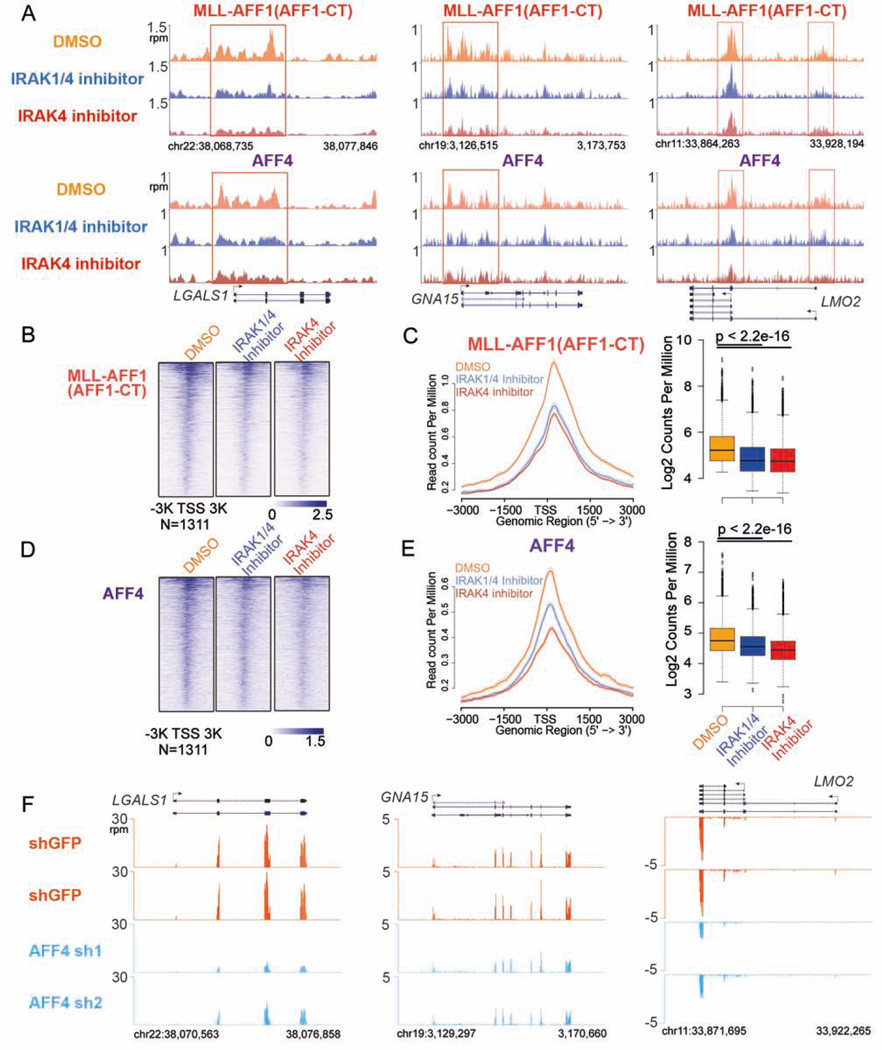
Figure 6. IRAK inhibition displaces MLL chimera and SEC occupancy at a subset of MLL chimera and SEC target genes.
(A) IRAK inhibitors decrease MLL-AFF1 and SEC occupancy at the LGALS1, GNA15 and LMO2 genes in SEM cells. Genome browser views of MLL-AFF1 (AFF1-CT) and SEC component AFF4 occupancy at the LGALS1, GNA15 and LMO2 genes are shown. Red boxes indicate the promoter-proximal regions with decreased MLL-AFF1 and AFF4 occupancy.
(B–C) We identified 1311 promoter regions (± 3kb of the TSS) in which MLL-AFF1 occupancy was altered by IRAK inhibitors. These regions are plotted as heatmaps (B) and metagene plots, and the Wilcoxon signed-rank test was used to show that MLL-AFF1 occupancy is significantly decreased after IRAK inhibition (C).
(D–E) Heatmap, metagene and statistical analysis of AFF4 occupancy at the 1311 promoter regions.
(F) RNA-seq genome browser track examples indicating that AFF4 knockdown reduces the expression of the LGALS1, GNA15 and LMO2 genes in SEM cells.
See also Figures S6.

