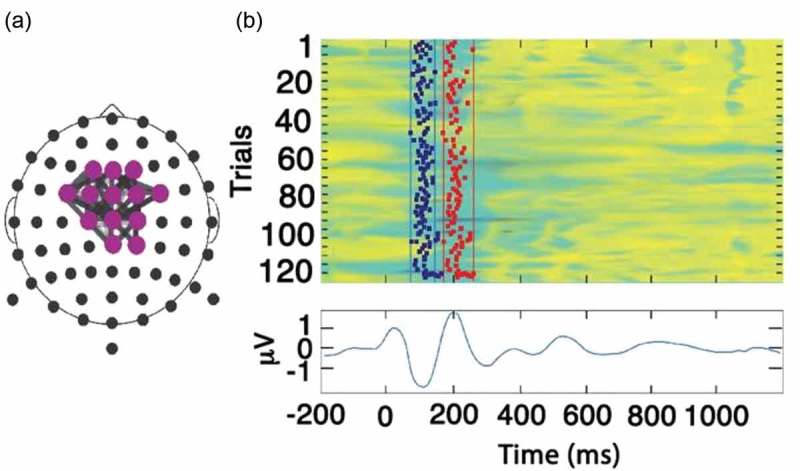
Figure 1.

(a) The Reference Brain Network Model (RBNM) is displayed in a time-collapsed figure. A coloured circle at a specific electrode denotes activity recorded from a specific recording channel. Grey-shaded lines connect a pair of events/electrodes. (b) Reference group average ERP (N100 and P200). The coloured panel has 120 rows, one for each subject. In each row, the average activity of each subject is presented for the duration of the recorded epoch. Cool and warm colours represent negative and positive values, respectively. Vertical lines in the top panel represent the minimal (left) and maximal (right) permitted latency limits of the electrode activity within the pattern.
