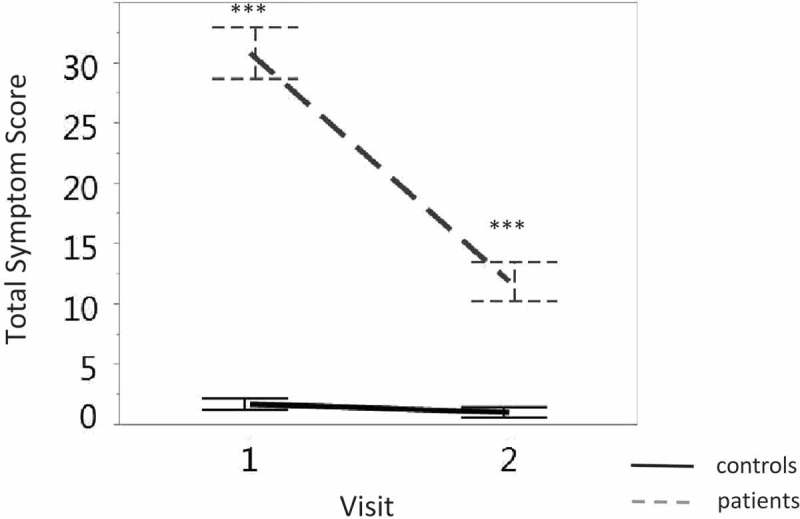
Figure 2.

Discrimination between the total symptom score (y-axis) of subjects in the concussion group (grey dashed line) and those in the control group (solid black line) across visits (x-axis). Vertical lines denote the standard error. ∗∗∗ p < 0.0001.
