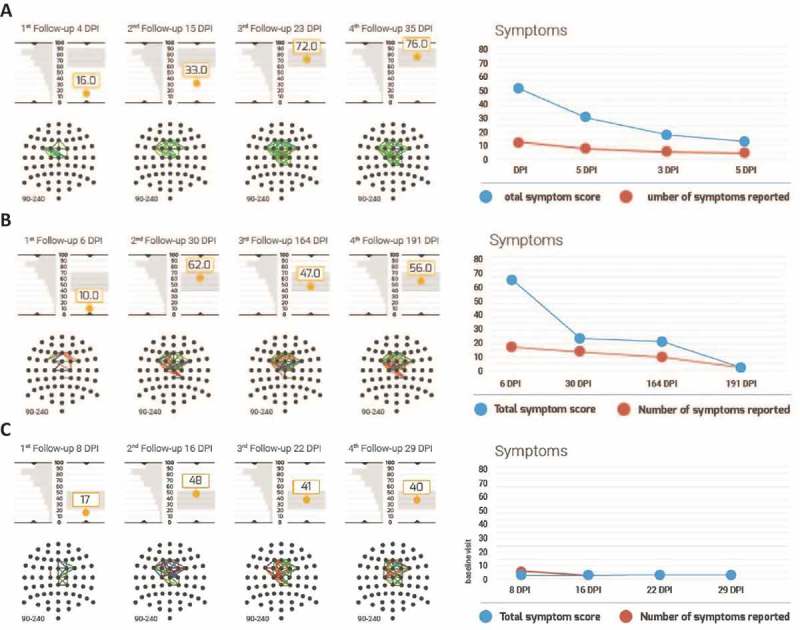
Figure 4.

Individual BNA scores and symptoms of three representative patients. (a–c) Data for reported cases 1–3, respectively. In each panel, BNA data are presented on the left hand side and symptom scores are depicted on the right hand side. BNA results include the BNA scores at each visit to the clinic, below which the individual BNA network is shown. The BNA scores are shown along with the 1 SD margins of expected intra-visit variability (see Methods) as a grey rectangle. This 1 SD margin is centred around the score of the last available visit in order to facilitate the clinician’s evaluation of BNA stabilization (if the score remains within the 1 SD expected variance margins for two consecutive visits, the BNA may suggest a stabilization). To the left of each score is the first visit of the test–re-test data (i.e. the ‘test’), which is tilted vertically such that the score’s graph y-axis is also the distribution’s x-axis. Finally, the symptom score graph at the right hand side represents the number of total symptoms in red and the total symptom score in blue.
