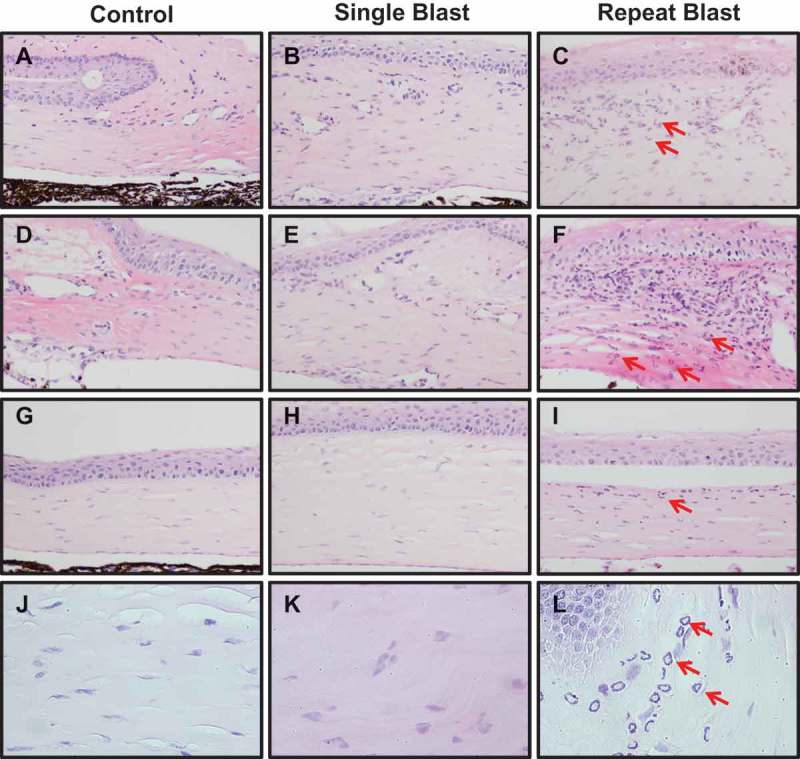
Figure 6.

Neutrophil infiltration in the cornea close to the limbus (A–F) and the center of cornea (G–I) of control, single, or repeat blast-exposed rats (red arrows indicate neutrophils), 20× magnification. (J–L) Images of all groups obtained with 40× magnification. Images are representative of five to six animals for each group. Two tissues per animal from the center cut of the cornea were assessed for neutrophil infiltration.
