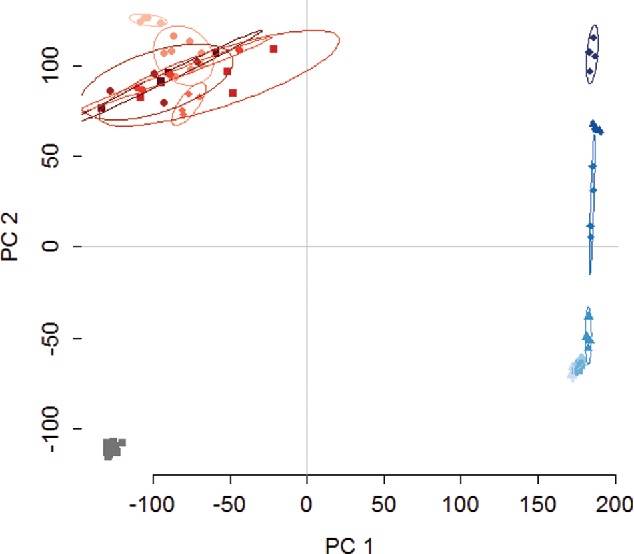
Figure 6.

Biplot from principal component analysis (PCA). Water (grey), HCl (red), and NaOH (blue) each form distinct groups, and the NaOH concentrations form distinct groups. The cluster in the top left quadrant represents the HCl samples, while the cluster on the far right represents NaOH, and the cluster in the left lower quadrant represents the control samples (water). The ellipses represent 90% confidence intervals. PC1 and PC2 are the first and second components from PCA, respectively.
