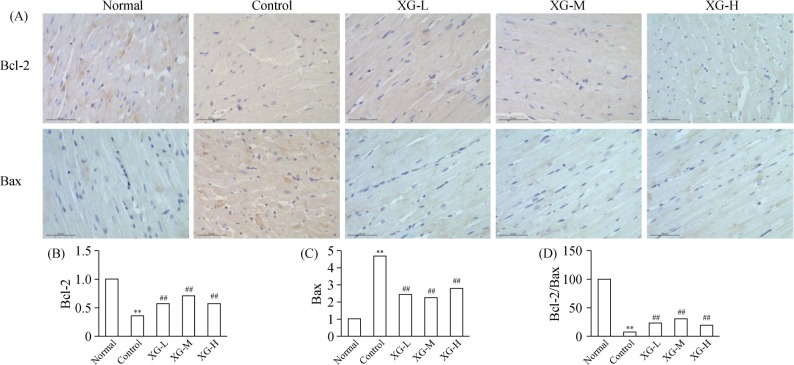
Figure 4. The expression of Bcl-2 and Bax protein in the left ventricle myocardial tissues (× 400).
(A): The representative protein products of Bcl-2 and Bax protein in normal, control, XG-L, XG-M and XG-H group were measured by immunohistochemistry analysis; (B): the expression of Bcl-2 protein in each group; (C): Bax protein expression in each group; (D): the ratio of Bcl-2/Bax in each group. **P < 0.01 vs. normal group; ##P < 0.01 vs. control group. XG-H: high-dose of Xinfuli Granule group; XG-L: low-dose of Xinfuli Granule group; XG-M: medium-dose of Xinfuli Granule group.

