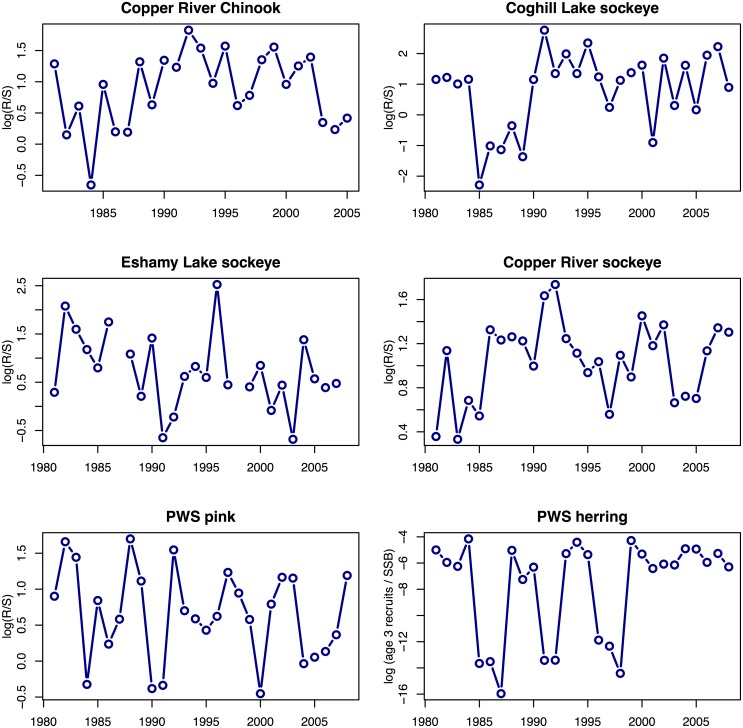
Fig 3. Time series of recruits-per-spawner relationship for data included in our analysis.
Raw data are shown for the years included in our analysis. R = recruits, S = spawners, SSB = spawning stock biomass, age-3 recruits = millions of mature and immature age-3 herring, and PWS = Prince William Sound.

