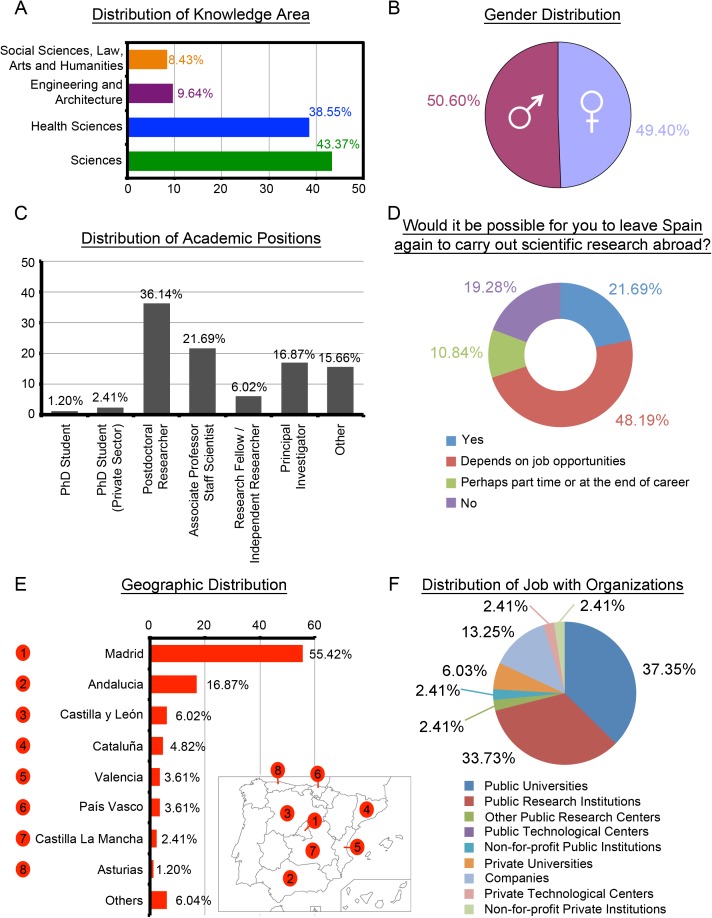
Fig 2. Profile of Scientists Returned to Spain (n = 83).
(A) Distribution of knowledge areas in percentage. (B) Gender distribution in percentage. (C) Distribution of academic positions in percentage; by default, these positions are in the Public Sector unless otherwise stated. (D) Distribution of opinion about a hypothetical leaving Spain again in percentage. (E) Distribution of geographic locations in the top-8 autonomous regions. Bottom-right is a map of Spain indicating autonomous regions; Others refers to "Aragón (1.20%), Canarias (1.20%), Galicia (1.20%), Murcia (1.20%), Navarra (1.20%)". (F) Distribution of job with organizations within the Public and Private Sectors.

