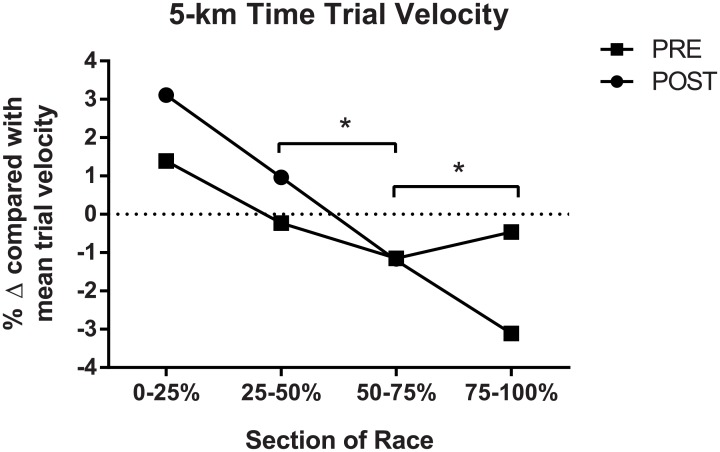
Fig 3. On-water rowing performance via 5 km time trial between PRE and POST.
Mean boat velocity for each trial was calculated, with each split (0–25%, 25–50%, 50–75%, 75–100% of race) assessed for percent change compared with the mean. Where a significant interaction between time points is observed, * indicates p < 0.05.

