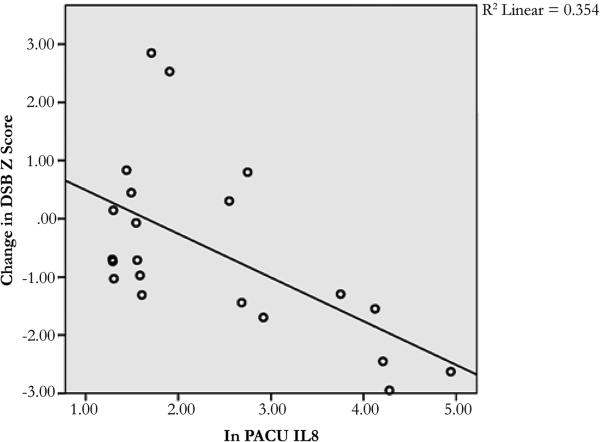
Figure 3.
Plot illustrating correlation between change in DSB z score versus PACU IL8 point value. The linear fit has a correlation coefficient of r = −0.561, and p= 0.008. Both axis are log scale. (Raw p values < 0.004 would survive correction. It is further unlikely by chance alone to have 6 correlation at p < 0.05, plus 5 correlations at p<0.01 in a population of 24 comparisons.)

