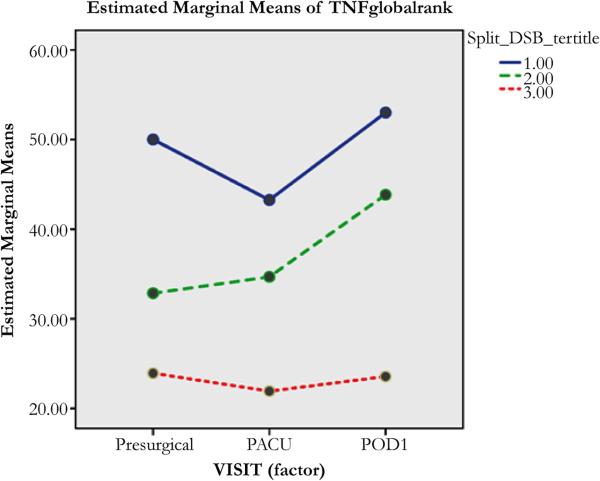
Figure 5.
The FIG. 5 plot is similar to FIG. 4. substituting TNF for IL8 and DSB for DSF. As above, plots of TNF means were formed from a tertile based on how much loss there was in DSB scores from baseline until 6 months. The solid blue line shows the worst 33% of the population in terms of negative change in DSB performance; the green dashed lines are middle third of the DSB loss values; and, the red dots plot the best cognitive outcomes. The DSB tertile between subject effect is significant (p=0.014) in terms of the trajectory of TNF across all time points. Factor and interaction are not significant.

