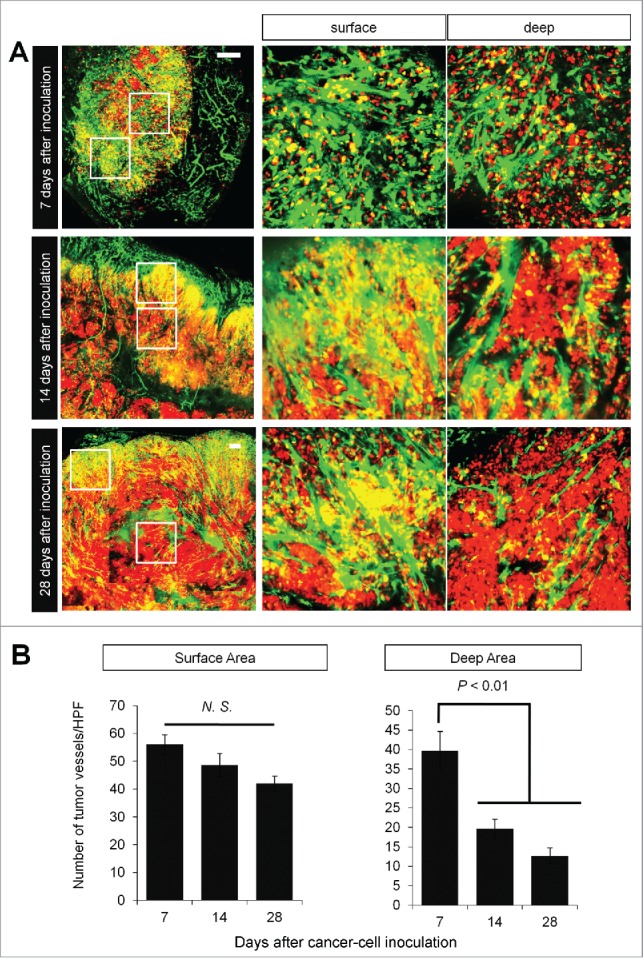
Figure 3.

Time-course imaging of FUCCI-expressing tumor in nestin-GFP driven transgenic nude mice. Experimental setup. FUCCI-expressing MKN45 cells (1×10⁷ cells/mouse) were injected subcutaneously into the left flanks of nestin-GFP transgenic mice. (A) Representative image of cross section of nascent tumor (7 d after inoculation), intermediate tumor (14 d after inoculation), and established tumor (28 d after inoculation). (B) Bar graphs show the number of nascent tumor vessels/high powerfield (HPF) at different time points after cancer-cell inculation at the surface of deep area of tumors.
