
Figure 3.
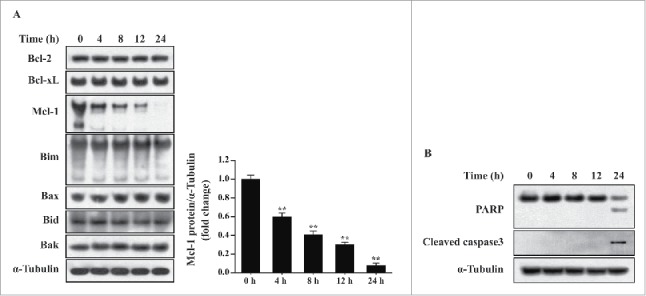
T. gondii-induced Mcl−1 downregulation and apoptosis in hUC-MSCs. hUC-MSCs were infected with T. gondii at an MOI of 5 for the indicated time durations. (A) Left, the protein levels of selected Bcl−2 family members were quantified by western blotting with α-Tubulin as a loading control. Representative blots of 3 independent experiments with similar results are shown. Right, fold changes of Mcl−1 levels in comparison with the results for the cells without T. gondii infection after normalization with the α-Tubulin level are shown (**P < 0.01). (B) The expression levels of PARP and cleaved caspase-3 in hUC-MSCs were determined by using western blotting. Three independent experiments were conducted showing similar results, and one representative blot is shown.