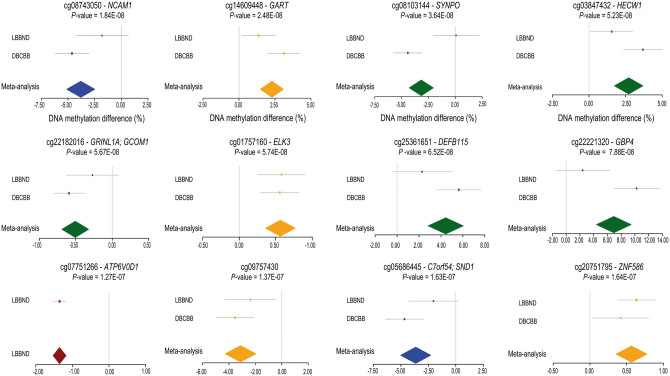
Figure 1.
Forest plots showing the top-ranked schizophrenia-associated differentially methylated positions (DMPs). Shown are data for 12 DMPs associated with schizophrenia at a highly stringent significance threshold (P < 1.66E-07) derived using permutations to estimate the nominal P-value for 5% family-wise error. Additional information on these DMPs is given in Table 2. Colour depicts a brain region in which the schizophrenia-association was identified: prefrontal cortex = blue, striatum = green, hippocampus = red, and cerebellum = yellow.

