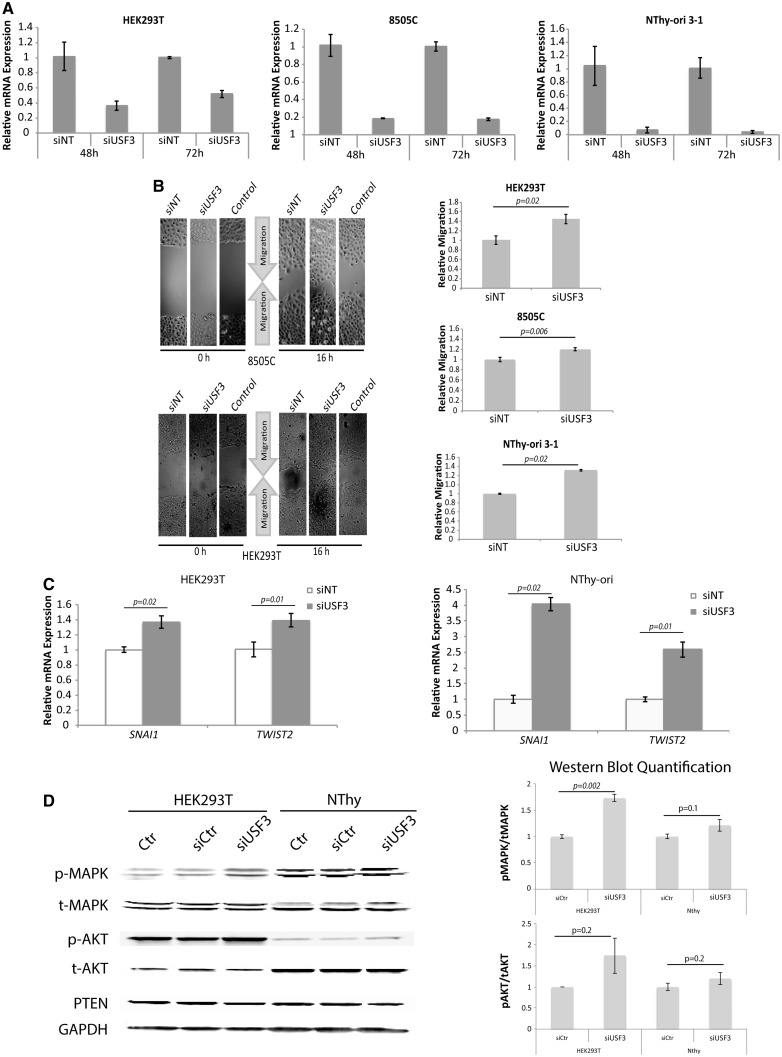
Figure 2.
Enhanced migration and EMT signature after USF3 knockdown. (A) qPCR experiment showing the decrease of USF3 relative mRNA expression in siUSF3 cells compared to non-targeting controls (siNT) with GAPDH as internal loading control for normalization, in HEK293T, 8505C, and NThy-ori 3-1 cells at both 48 and 72 h after transfection. Data represent mean values ± SEM, with two independent assays performed in triplicates. (B) Phase-contrast microscopy images of wound healing assay, showing consistent increase of migration in all three cell lines after USF3 knockdown compared to both non-targeting siNT control and non-transfection control cells. The relative migration was calculated as the difference in scratch distance between time 0 and 16 h, normalized to siNT controls. For each image, distance between one side of the scratch and the other was measured and quantified using Adobe Photoshop at three different locations, in each of three different representative images (total of nine measurements) for each time point. Data represent mean values ± SEM. P value was calculated by two-sided Student’s test. (C) EMT markers SNAI1 and TWIST2 RNA expression were elevated after USF3 knockdown with qPCR quantification compared to siNT controls, normalized to GAPDH internal loading control. Data represent mean values ± SEM, with two independent assays performed in triplicates. P value was calculated by two-sided Student’s t-test. (D) Western blot showing increased pMAPK (mild increase in pAKT) after USF3 knockdown, GAPDH was used as loading control. Quantifications of pMAPK/tMAPK and pAKT/tAKT on right panel were done with ImageJ, with two independent assays for both siRNA and shRNA transfected cells. Data represent mean values ± SEM, P value was calculated by two-sided Student’s t-test.

