Figure 3.
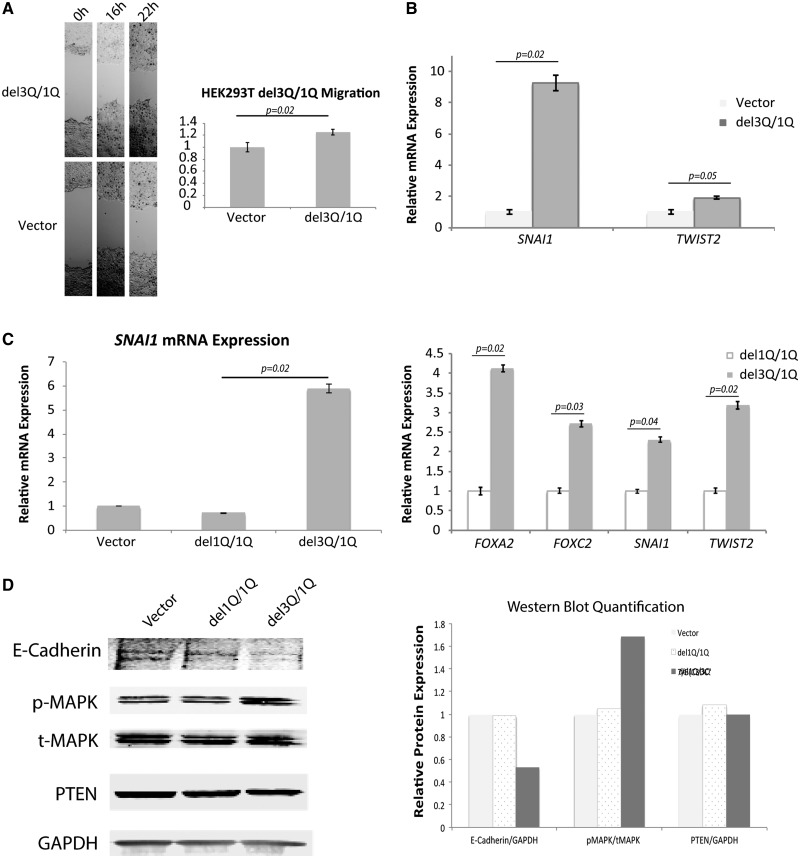
Enhanced migration and EMT signature with USF3del1Q/3Q expression. (A) Phase-contrast microscopy images of wound healing assay, showing increased migration of HEK293T cells with USF3del3Q overexpression on its endogenous USF3del1Q background (mimicking the del1Q/3Q compound heterozygote state), compared to empty vector-transfected control. The relative migration was calculated as the difference in scratch distance between 0 h and 16 h, or 22 h normalized to vector controls. For each image, distance between one side of the scratch and the other was measured and quantified using Adobe Photoshop at three different locations, in each of three different representative images (total of nine measurements) for each time point. Data represent mean values ± SEM. P value was calculated by two-sided Student’s test. (B) EMT markers SNAI1 and TWIST2 RNA expression increases with USF3del3Q overexpression in USF3del1Q cells, with qRT-PCR quantification compared to vector control, normalized to GAPDH internal loading control. Data represent mean values ± SEM, with two independent assays performed in triplicates. P value was calculated by two-sided Student’s test. (C) qRT-PCR show SNAI1, FOXA2, FOXC2, and TWIST2 RNA expression increases only in USF3del3Q overexpressing cells (with the composite del1Q/del3Q genotype) but not USF3del1Q overexpressing cells. Data represent mean values ± SEM, with two independent assays performed in triplicates. P value was calculated by two-sided Student’s test. (D) Western blot showing increased p-MAPK without change in t-MAPK or PTEN, and diminished E-Cadherin with USF3del3Q overexpression. GAPDH was used as overall loading control. Quantitation of E-Cadherin/GAPDH, pMAPK/tMAPK, and PTEN/GAPDH on the right panel were performed using ImageJ for empty vector, USF3del1Q and USF3del3Q overexpressed cells.

