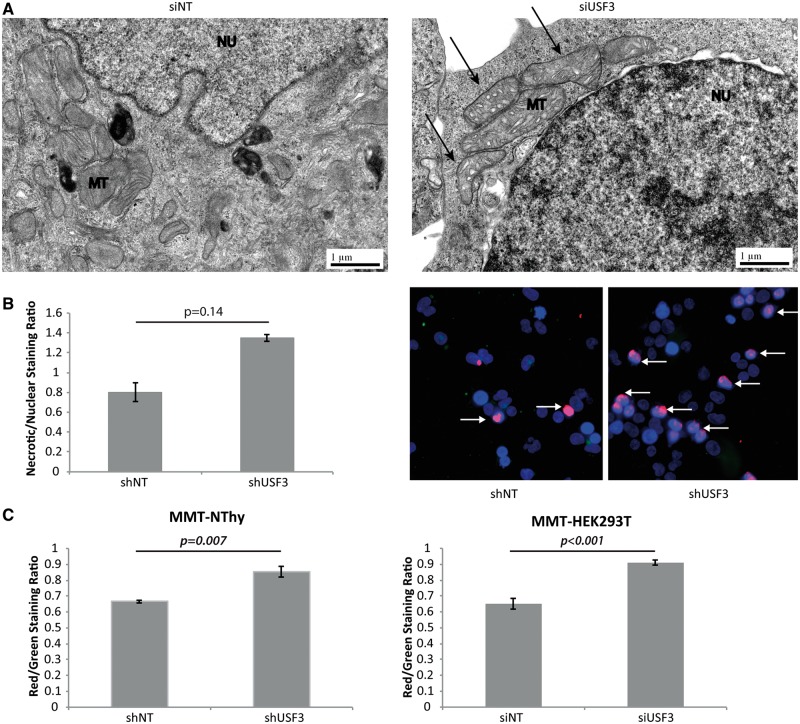
Figure 4.
USF3 knock down cells have necrosis-like features. (A) Transmission electron microscopy images of non-targeting siNT control and siUSF3 transfected HEK293T cells. Arrows in the right panel point to mitochondria showing white spaces indicating swollen cristae. MT: mitochondrion; NU: nucleus. (B) Fluorescent necrosis staining. Left panel: quantification of ratio of necrosis staining to nuclear Hoechst 33342 staining, and normalized to the mean of shNT cells. Right panel: Representative fluorescent microscopy images showing more Texas Red necrosis staining in shUSF3 cells, pointed with arrows. (C) JC-1 mitochondrial membrane potential (MMP) measured in both NThy and HEK293T cells. Increased red/green fluorescence intensity indicates elevated MMP. Measurements were performed in triplicate with each triplicate repeated three times. Data represent mean values ± SEM. P-value was calculated by two-sided Student’s T-test.

